目录
- 1.前言
- 2.先来看效果图
- 3.步骤详解
- 3.1vue3安装highcharts
- 3.2如何使用,如何按需引入
- 4.封装RadialBar组件,包括图表的点击事件
- 4.1RadialBar.vue思路
- 4.2RadialBar.vue完整代码
- 4.3使用RadialBar.vue
- 4.4css如何实现三角箭头的生成
- 5.总结
1.前言
目前正在做vue3的数据可视化项目,vue3的组合式api写法十分方便,可以有各种玩法,有兴趣的同学可以看我个人主页的其他文章。难点是在网上找了一圈的有关径向条形图的示例都没有好的解决方案,决心亲自下手,在其中有一些试错,所以总结出来了一套方法,如何引入Highcharts,以及如何从0开始使用径向条形图,知识点包括:
- vue引入和配置Highcharts
- 封装径向条形图的组件:RadialBar.vue,使用数据驱动页面
- 径向条形图上的点击事件,获取参数,调用接口进行详情查看
2.先来看效果图

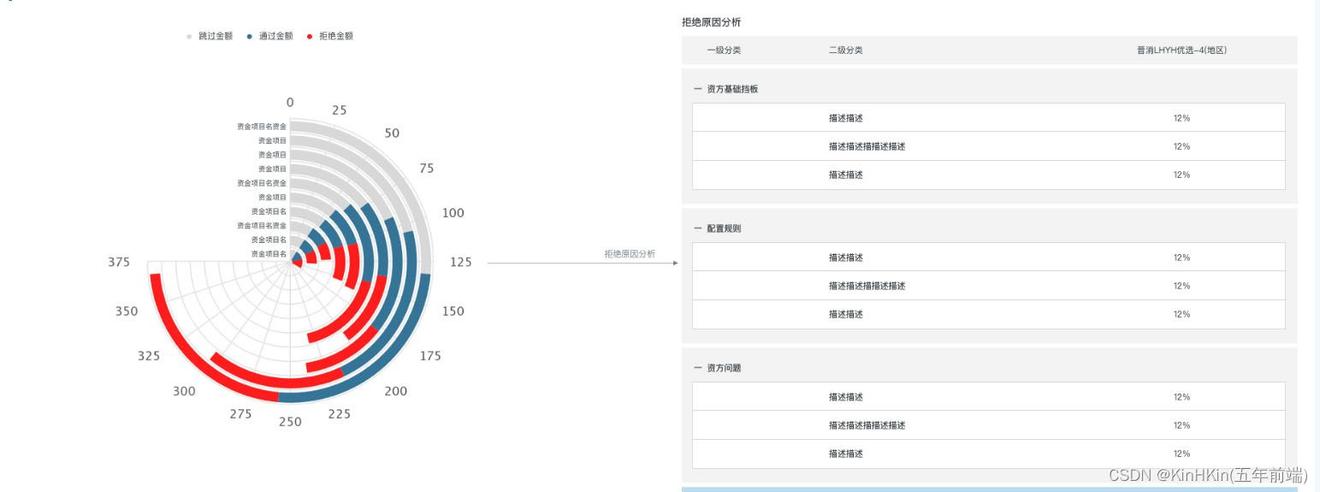
UI效果图:

实战效果图:

3.步骤详解
3.1vue3安装highcharts
$ npm install highcharts --save
注意:在组件内部引入需要的插件,很关键,这点我踩了一下午坑,必须需要的组件部分,必须引入。比如:
import Highcharts from 'highcharts' // 必须引入
目前使用的版本:"highcharts": "^10.2.1", 依赖项:dependencies
试错:官网上是给vue提供了专门的highcharts-vue,这里我没有使用,因为highcharts-vue前提的必须安装highcharts,有兴趣的同学可以看官网 Highcharts Vue | Highcharts 使用教程
3.2如何使用,如何按需引入
使用的时候,在自定义的组件里面引入官方实例下的包,举个列子:

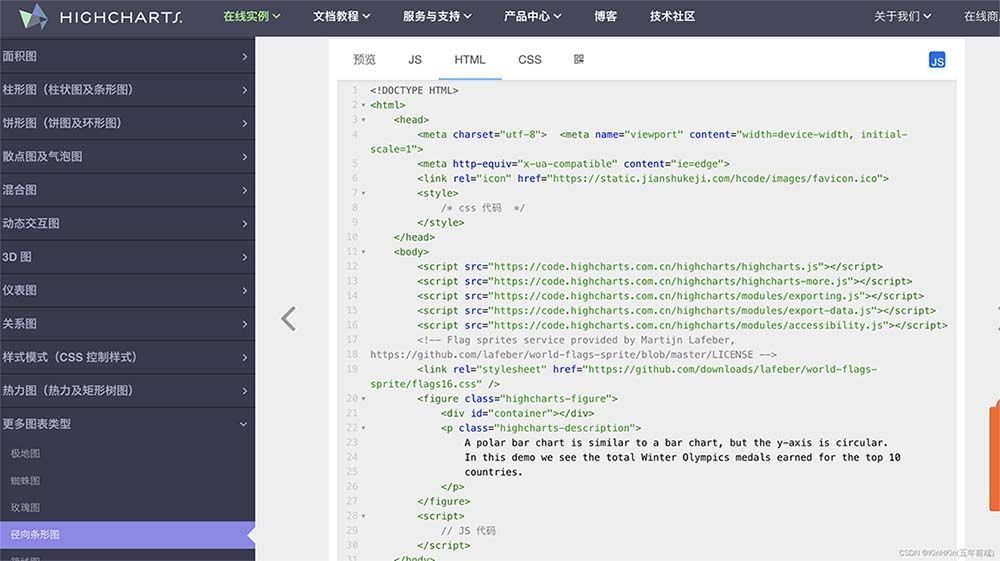
官网的这个例子html文件里面有很多包,在vue组件里面可以这么引入:
| import Highcharts from "highcharts"; //必须引入 | |
| import highchartsMore from "highcharts/highcharts-more"; // 扩展包 | |
| // import exporting from "highcharts/modules/exporting"; // 导出图例包 | |
| // import exportData from "highcharts/modules/export-data"; //导出数据包 | |
| // import accessibility from "highcharts/modules/accessibility"; // 辅助类配置图表可访问性包 可以阅读官网 https://api.highcharts.com.cn/highcharts/accessibility.highContrastTheme.html | |
| highchartsMore(Highcharts); | |
| // exporting(Highcharts); | |
| // exportData(Highcharts); | |
| // accessibility(Highcharts); |
其实真正用到的也就两个包,其他是导出,和辅助类的包,但是highcharts支持3d渲染,如果用到3d效果,必须引入3d的包,比如3d漏斗图:
| import highcharts3d from "highcharts/highcharts-3d"; | |
| import funnel3d from "highcharts/modules/funnel3d"; |
4.封装RadialBar组件,包括图表的点击事件
4.1RadialBar.vue思路
接受props.list数据用于驱动图表页面,回调点击事件方法给父组件使用,父组件通过响应式的数据再传递参数给右侧的拒绝原因分析组件:
接受props:
| const props = defineProps({ | |
| list: Array, | |
| }); |
点击事件和回调函数:
| series: [ | |
| { | |
| name: "跳过金额", | |
| data: props.list.map((item) => item.m1), | |
| events: { | |
| click: function (e: any) { | |
| chartClick(e); | |
| }, | |
| }, | |
| }, | |
| ] | |
| const emit = defineEmits(["chartsParams"]); | |
| function chartClick(data) { | |
| emit("chartsParams", data); | |
| console.log(data.point, "data"); | |
| } |
4.2RadialBar.vue完整代码
| <!--功能说明: 资产规划路由地图:: 径向条形图--> | |
| <template> | |
| <div class="radial-bar" id="RadialBar"></div> | |
| </template> | |
| <script setup lang="ts"> | |
| import { nextTick, onMounted, reactive } from "@vue/runtime-core"; | |
| import { number } from "echarts"; | |
| import Highcharts from "highcharts"; //必须引入 | |
| import highchartsMore from "highcharts/highcharts-more"; // 扩展包 | |
| // import exporting from "highcharts/modules/exporting"; // 导出图例包 | |
| // import exportData from "highcharts/modules/export-data"; //导出数据包 | |
| // import accessibility from "highcharts/modules/accessibility"; // 辅助类配置图表可访问性包 可以阅读官网 https://api.highcharts.com.cn/highcharts/accessibility.highContrastTheme.html | |
| highchartsMore(Highcharts); | |
| // exporting(Highcharts); | |
| // exportData(Highcharts); | |
| // accessibility(Highcharts); | |
| const props = defineProps({ | |
| list: Array, | |
| }); | |
| function getCharts() { | |
| Highcharts.chart("RadialBar", { | |
| colors: ["#DDDDDD", "#3B7FA3", "#FF0000"], // 颜色区域 | |
| chart: { | |
| type: "column", | |
| inverted: true, | |
| polar: true, | |
| }, | |
| title: { | |
| text: "", | |
| }, | |
| legend: { | |
| enabled: true, | |
| verticalAlign: "top", | |
| symbolHeight: 8, | |
| itemStyle: { | |
| fontSize: 12, | |
| }, | |
| }, | |
| tooltip: { | |
| outside: true, | |
| }, | |
| pane: { | |
| size: "75%", | |
| endAngle: 270, | |
| center: ["50%", "50%"], // 控制图表位置 | |
| }, | |
| xAxis: { | |
| tickInterval: 1, | |
| labels: { | |
| align: "right", | |
| useHTML: true, | |
| allowOverlap: true, | |
| step: 1, | |
| y: 4, | |
| style: { | |
| fontSize: "12px", | |
| }, | |
| }, | |
| lineWidth: 0, | |
| categories: props.list.map((item) => item.categories), | |
| // [ | |
| // "资金方 <span>id</span>", | |
| // "资金方", | |
| // "资金方", | |
| // "资金方", | |
| // "资金方", | |
| // "资金方", | |
| // "资金方", | |
| // "资金方", | |
| // "资金方", | |
| // "资金方", | |
| // ], | |
| }, | |
| yAxis: { | |
| lineWidth: 0, | |
| tickInterval: 25, | |
| reversedStacks: false, | |
| endOnTick: true, | |
| showLastLabel: true, | |
| style: { | |
| fontSize: "14px", | |
| }, | |
| }, | |
| plotOptions: { | |
| column: { | |
| stacking: "normal", | |
| borderWidth: 0, | |
| pointPadding: 0, | |
| groupPadding: 0.15, | |
| }, | |
| }, | |
| credits: { | |
| enabled: false, // 禁用版权信息 | |
| }, | |
| series: [ | |
| { | |
| name: "跳过金额", | |
| data: props.list.map((item) => item.m1), | |
| events: { | |
| click: function (e: any) { | |
| chartClick(e); | |
| }, | |
| }, | |
| }, | |
| { | |
| name: "通过金额", | |
| data: props.list.map((item) => item.m2), | |
| events: { | |
| click: function (e: any) { | |
| chartClick(e); | |
| }, | |
| }, | |
| }, | |
| { | |
| name: "拒绝金额", | |
| data: props.list.map((item) => item.m3), | |
| events: { | |
| click: function (e: any) { | |
| chartClick(e); | |
| }, | |
| }, | |
| }, | |
| ], | |
| }); | |
| } | |
| const emit = defineEmits(["chartsParams"]); | |
| function chartClick(data) { | |
| emit("chartsParams", data); | |
| console.log(data.point, "data"); | |
| } | |
| onMounted(() => { | |
| nextTick(() => { | |
| getCharts(); | |
| }); | |
| }); | |
| </script> | |
| <style lang="less" scoped> | |
| .radial-bar { | |
| height: 550px; | |
| width: 100%; | |
| } | |
| </style> |
4.3使用RadialBar.vue
<RadialBar :list="list" @chartsParams="chartsParams" />
数据模拟:
| const list = ref([]); | |
| for (let i = 0; i < 10; i++) { | |
| list.value.push({ | |
| categories: "资金方" + i + 1, // 名称 | |
| m1: 27 + i * 2, // 跳过金额 | |
| m2: 21 + i * 2, // 通过金额 | |
| m3: 20 + i * 2, // 拒绝金额 | |
| }); | |
| } | |
| const chartsParamsObj = ref({}); | |
| function chartsParams(data: any) { | |
| chartsParamsObj.value = data; | |
| console.log(data, "chartsParams"); | |
| } |
4.4css如何实现三角箭头的生成
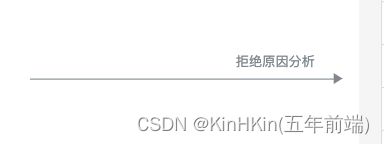
图例:

方法:
| .line-arrow { | |
| width: 30%; | |
| // height: 1px; | |
| border-bottom: 1px solid #7e888e; | |
| height: 25px; | |
| text-align: right; | |
| font-size: 12px; | |
| font-family: PingFangSC-Regular, PingFang SC; | |
| font-weight: 400; | |
| color: #7e888e; | |
| padding-right: 20px; | |
| align-self: center; | |
| position: relative; | |
| &:after { | |
| content: ""; | |
| position: absolute; | |
| border-top: 5px solid transparent; | |
| border-bottom: 5px solid transparent; | |
| border-left: 8px solid #7e888e; | |
| border-right: 5px solid transparent; | |
| top: 19px; | |
| right: -10px; | |
| } | |
| } |
5.总结
在做数据平台开发时候,大数据驱动页面的情况很常见,并且大数据的展示,一般以图表类,居多,掌握一种图表往往不够,比如会echarts,但是 echarts有很多图表效果满足不了需求,就如现在我开发的径向条形图,echarts很难实现,学习highcharts是有成本的,本文能希望能你在highchart的使用上有所帮助。通过一种使用,其他的举一反三