目录
- c# chart缩放,局部放大
- 放大
- 缩小
- c# chart表格
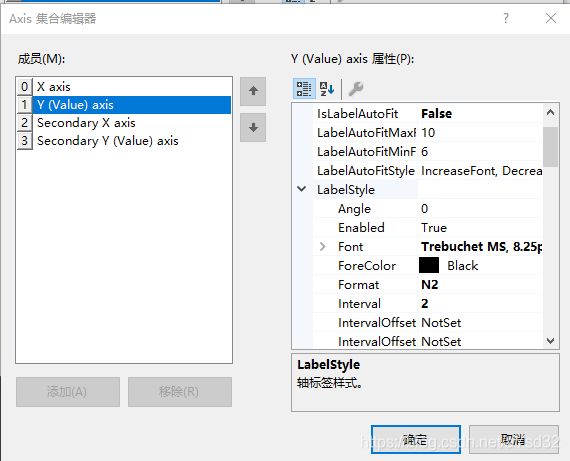
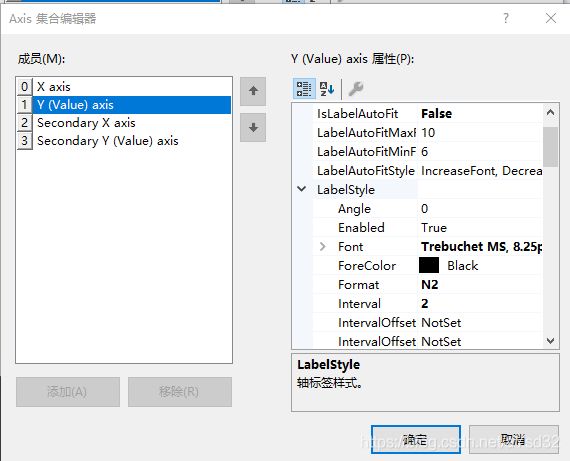
- 设置间隔与小数点
- 网格刻度
- 总结
c# chart缩放,局部放大
效果:
左键划选放大区域,右键恢复
| /// <summary> | |
| /// 初始化,传入要进行初始化的chart | |
| /// </summary> | |
| /// <param name="chart"></param> | |
| public static void InitChart (System.Windows.Forms.DataVisualization.Charting.Chart chart) | |
| { | |
| //开启缩放功能 | |
| chart.ChartAreas[0].CursorX.Interval = 0; | |
| chart.ChartAreas[0].CursorX.IsUserEnabled = true; | |
| chart.ChartAreas[0].CursorX.IsUserSelectionEnabled = true; | |
| chart.MouseClick += new System.Windows.Forms.MouseEventHandler(chart_MouseClick); | |
| } | |
| //右键恢复缩放 | |
| static void chart_MouseClick(object sender, MouseEventArgs e) | |
| { | |
| Chart chart = sender as Chart; | |
| //右键恢复事件 | |
| if (e.Button == MouseButtons.Right) | |
| { | |
| chart.ChartAreas[0].AxisX.ScaleView.ZoomReset(0); | |
| } | |
| } |
放大
仅针对x轴(y轴同理)
| chartArea.CursorX.IsUserEnabled = true; | |
| chartArea.CursorX.IsUserSelectionEnabled = true; |
缩小
chart.ChartAreas[0].AxisX.ScaleView.ZoomReset();
- ZoomReset(0); —— 撤销所有放大动作
- ZoomReset(1); —— 撤销上一次放大动作
设置滚动条宽度
chart.ChartAreas[0].AxisX.ScrollBar.Size = 5;
以上所有方法也可以在chart属性里直接进行设置
获取选区坐标
| Console.WriteLine(chart.ChartAreas[0].AxisX.ScaleView.ViewMinimum);//当前显示范围最小坐标 | |
| Console.WriteLine(chart.ChartAreas[0].AxisX.ScaleView.ViewMaximum);//当前显示范围最大坐标 |
c# chart表格
- series1属性中XAxisType属性值设置为:Primary
- series2属性中XAxisType属性值设置为:Secondary
添加series会导致图表预览不可用

设置间隔与小数点

网格刻度
| //ChartArea chartArea = chart.ChartAreas[0]; | |
| //表格标题内容 | |
| Title title = new Title(); | |
| title.Font = new System.Drawing.Font("宋体",F); | |
| title.Text = "压机曲线波动分析"; | |
| chart.Titles.Add(title); | |
| //设置坐标轴标题 | |
| chart.ChartAreas[0].AxisX.Title = "位 移 / mm "; | |
| chart.ChartAreas[0].AxisY.Title = "压 力 / Kg "; | |
| //X,Y轴的最大值最小值 | |
| chart.ChartAreas[0].AxisX.Minimum = 0; | |
| chart.ChartAreas[0].AxisX.Maximum = 100; | |
| chart.ChartAreas[0].AxisY.Minimum = 0; | |
| chart.ChartAreas[0].AxisY.Maximum = 200; | |
| // 设置X,Y的坐标间距 | |
| chart.ChartAreas[0].AxisX.Interval = 1; | |
| chart.ChartAreas[0].AxisY.Interval = 5; | |
| //设置坐标轴标题的字体 | |
| chart.ChartAreas[0].AxisX.TitleFont = new System.Drawing.Font("宋体", 12F); | |
| chart.ChartAreas[0].AxisY.TitleFont = new System.Drawing.Font("宋体", 12F); | |
| //设置坐标轴栅格是否可见 | |
| chart.ChartAreas[0].AxisX.MajorGrid.Enabled = true; | |
| chart.ChartAreas[0].AxisY.MajorGrid.Enabled = true; | |
| //设置网格线 | |
| chart.ChartAreas[0].AxisX.MajorGrid.LineColor = System.Drawing.Color.Gainsboro; //颜色 | |
| chart.ChartAreas[0].AxisX.MajorGrid.Interval = 10; //网格间隔 | |
| chart.ChartAreas[0].AxisX.MinorGrid.Interval = 10; | |
| chart.ChartAreas[0].AxisY.MajorGrid.LineColor = System.Drawing.Color.Gainsboro; | |
| chart.ChartAreas[0].AxisY.MajorGrid.Interval = 20; | |
| chart.ChartAreas[0].AxisY.MinorGrid.Interval = 20; | |
| 放大表格 | |
| chart.ChartAreas[0].AxisX.ScaleView.Zoom(2, 3); | |
| chart.ChartAreas[0].AxisX.ScaleView.Zoomable = false; | |
| chart.ChartAreas[0].AxisX.ScaleView.Size = 20; | |
| Zoom into the X axis | |
| Enable range selection and zooming end user interface | |
| chart.ChartAreas[0].CursorX.IsUserEnabled = true; | |
| chart.ChartAreas[0].CursorX.IsUserSelectionEnabled = true; | |
| chart.ChartAreas[0].AxisX.ScaleView.Zoomable = true; | |
| //将滚动内嵌到坐标轴中 | |
| chart.ChartAreas[0].AxisX.ScrollBar.IsPositionedInside = true; | |
| chart.ChartAreas[0].AxisY.ScrollBar.IsPositionedInside = true; | |
| //曲线类型 | |
| chart.Series[0].ChartType = SeriesChartType.Spline; | |
| chart.Series[1].ChartType = SeriesChartType.Spline; | |
| chart.Series[10].ChartType = SeriesChartType.Spline; | |
| // 曲线 线宽像素 | |
| chart.Series[0].BorderWidth = 1; | |
| chart.Series[1].BorderWidth = 1; | |
| chart.Series[10].BorderWidth = 3; | |
| // 曲线的颜色 | |
| chart.Series[10].Color = System.Drawing.Color.Red; | |
| chart.Series[4].Color = System.Drawing.Color.Green; | |
| chart.Series[5].Color = System.Drawing.Color.RoyalBlue; | |
| //右上角的曲线名称是否显示 | |
| chart.Series[0].IsVisibleInLegend = true; | |
| chart.Series[1].IsVisibleInLegend = true; | |
| chart.Series[10].IsVisibleInLegend = true; | |
| //右上角的曲线名称 | |
| chart.Series[0].LegendText = "随机抽取曲线1"; | |
| chart.Series[1].LegendText = "随机抽取曲线2"; | |
| chart.Series[2].LegendText = "随机抽取曲线3"; | |
| chart.Series[3].LegendText = "随机抽取曲线4"; | |
| chart.Series[4].LegendText = "随机抽取曲线5"; | |
| chart.Series[5].LegendText = "随机抽取曲线6"; | |
| chart.Series[6].LegendText = "随机抽取曲线7"; | |
| chart.Series[7].LegendText = "随机抽取曲线8"; | |
| chart.Series[8].LegendText = "随机抽取曲线9"; | |
| chart.Series[9].LegendText = "随机抽取曲线10"; | |
| chart.Series[10].LegendText = "Average"; | |
| //名称的悬浮备注 | |
| chart.Series[10].LegendToolTip = "此乃10个随机曲线的平均值曲线"; | |
| chart.Series[0].LegendToolTip = "随机抽取曲线1备注"; | |
| chart.Series[1].LegendToolTip = "备注2"; | |
| //坐标Y值是否显示在图表中 | |
| //chart.Series[0].IsValueShownAsLabel = true; | |
| //chart.Series[1].IsValueShownAsLabel = true; | |
| //chart.Series[2].IsValueShownAsLabel = true; | |
| //chart.Series[3].IsValueShownAsLabel = true; | |
| //chart.Series[4].IsValueShownAsLabel = true; | |
| chart.Series[10].IsValueShownAsLabel = true; | |
| //chart.Series.Clear(); 使表格GGG | |
| //chart.Series.Dispose(); | |
| //设置网格线 | |
| chartDemo.ChartAreas[0].AxisX.MajorGrid.LineColor = Color.Gray; | |
| chartDemo.ChartAreas[0].AxisX.MajorGrid.Interval = 500;//网格间隔 | |
| chartDemo.ChartAreas[0].AxisX.MinorGrid.Interval = 500; | |
| chartDemo.ChartAreas[0].AxisX.MajorGrid.LineDashStyle = ChartDashStyle.Dash; //设置网格类型为虚线 | |
| chartDemo.ChartAreas[0].AxisY.MajorGrid.LineColor = Color.Gray; | |
| chartDemo.ChartAreas[0].AxisY.MajorGrid.Interval = 4; | |
| chartDemo.ChartAreas[0].AxisY.MinorGrid.Interval = 4; | |
| chartDemo.ChartAreas[0].AxisY.MajorGrid.LineDashStyle = ChartDashStyle.Dash;//网格Y轴线类型 | |
| this.chartDemo.ChartAreas[0].AxisX.MajorGrid.LineColor = System.Drawing.Color.Transparent; | |
| // this.chartDemo.ChartAreas[0].AxisY.MajorGrid.LineColor = System.Drawing.Color.Transparent; | |
| //滑轮设置 | |
| chartDemo.ChartAreas[0].AxisX.LabelStyle.Format = "HH:mm:ss"; | |
| chartDemo.ChartAreas[0].AxisX.ScaleView.Size = 8; | |
| chartDemo.ChartAreas[0].AxisX.ScrollBar.IsPositionedInside = true; | |
| chartDemo.ChartAreas[0].AxisX.ScrollBar.Enabled = true; | |
| private void chart_MouseEnter(object sender, MouseEventArgs e) | |
| { | |
| if (e.Delta >)//鼠标向上 | |
| { | |
| if (chart.ChartAreas["ChartArea1"].AxisX.ScaleView.Size < 100)//判断显示的最大数值 | |
| { | |
| // chart.ChartAreas["ChartArea1"].AxisX.ScaleView.Size += 2;//+=5---滚动一次显示5个 | |
| chart.ChartAreas["ChartArea1"].AxisX.ScaleView.Position += 2; | |
| } | |
| } | |
| else//鼠标向下滚动 | |
| { | |
| if (chart.ChartAreas["ChartArea1"].AxisX.ScaleView.Size > 1) | |
| { | |
| // chart.ChartAreas["ChartArea1"].AxisX.ScaleView.Size -= 2;// - = 5---滚动一次减小显示5个 | |
| chart.ChartAreas["ChartArea1"].AxisX.ScaleView.Position -= 2; | |
| } | |
| } | |
| } | |
| private void chart_MouseEnter(object sender, EventArgs e)//当鼠标移动到控件上-发生的事件 | |
| { | |
| MouseWheel += new MouseEventHandler(chart_MouseEnter);//调用滚轮事件 | |
| } |