前言
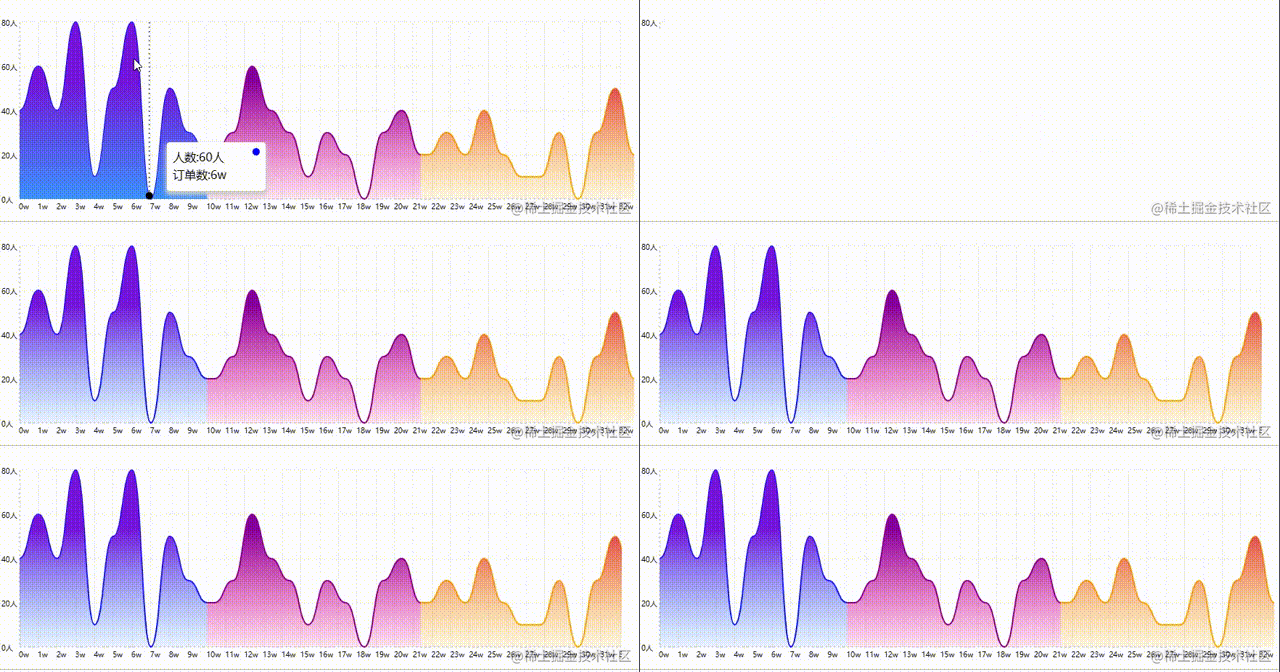
最近有个图表需求,怎么配置也配置不好,十分头疼。所以想借着这个问题手写实现一个交互体验还不错的曲线图,支持开场动画、自动根据父盒子宽度适配、比echarts更全的配置项,分区线段的可以更好的自定义等。 效果如下

源码: https://github.com/ccj-007/spark-echarts 同时已经发布到了npm库 :https://www.npmjs.com/package/spark-echarts
起源
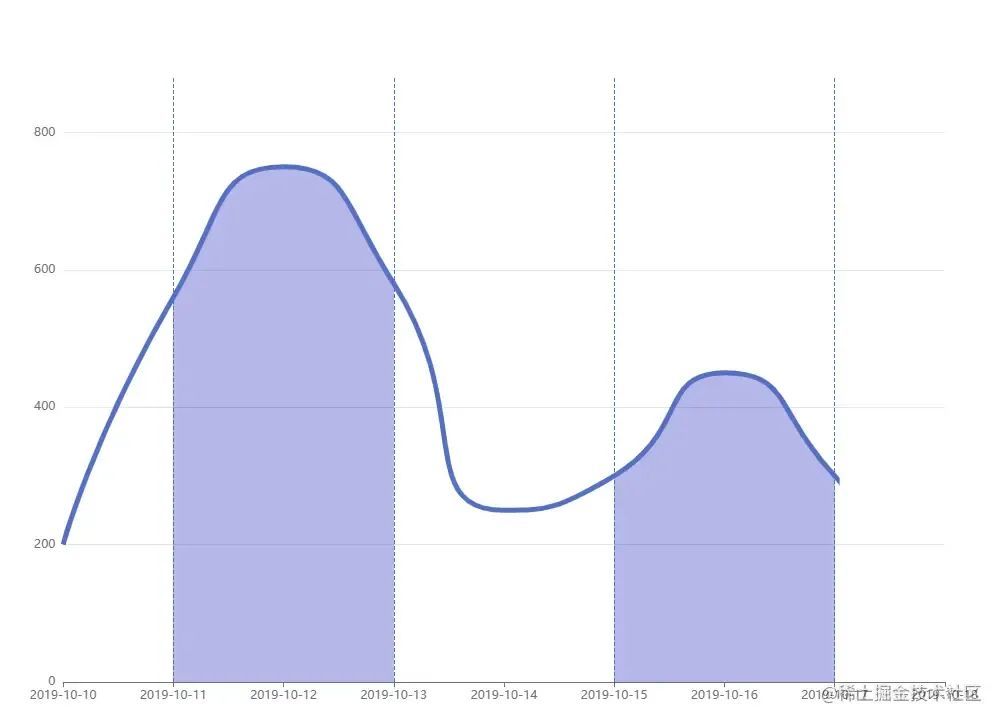
  visualMap: {
    type: 'piecewise',
    show: false,
    dimension: 0,
    seriesIndex: 0,
    pieces: [
      {
        gt: 1,
        lt: 3,
        color: 'rgba(0, 0, 180, 0.4)'
      },
      {
        gt: 5,
        lt: 7,
        color: 'rgba(0, 0, 180, 0.4)'
      }
    ]
  },
这里摘抄的是echarts官网的示例,颜色无法更高的自定义程度, 这种情况想做渐变不太行, 但是分区是实现了,手动狗头,让我们看看另外一个示例
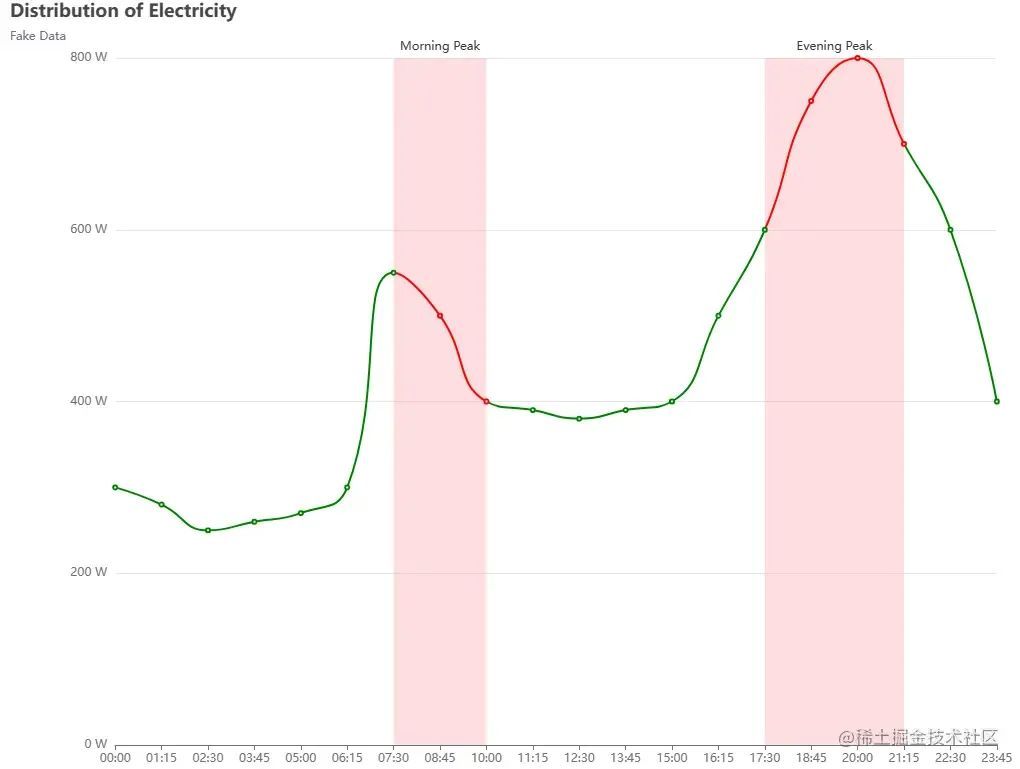
  series: [
    {
      type: 'line',
      smooth: 0.6,
      symbol: 'none',
      lineStyle: {
        color: '#5470C6',
        width: 5
      },
      markLine: {
        symbol: ['none', 'none'],
        label: { show: false },
        data: [{ xAxis: 1 }, { xAxis: 3 }, { xAxis: 5 }, { xAxis: 7 }]
      },
      areaStyle: {},
      data: [
        ['2019-10-10', 200],
        ['2019-10-11', 560],
        ['2019-10-12', 750],
        ['2019-10-13', 580],
        ['2019-10-14', 250],
        ['2019-10-15', 300],
        ['2019-10-16', 450],
        ['2019-10-17', 300],
        ['2019-10-18', 100]
      ]
    }
  ]
这种情况分区的线段颜色有了,但是渐变却不能区分,只能统一一个区域的渐变。
所以在我们平常开发,折线图或者曲线图一般用用echarts绰绰有余了,但是总有这么几个配置让人抓狂,比如要分区,分区的填充色要做渐变、线段要渐变、要支持hover并更改填充色、label更新等。虽然用echarts的markArea能实现一部分,但是看着那几个抓狂的api,既然追求完美落地,那就硬着头皮手写个吧
曲线图
分析思路

我们从总的canvas绘图思路来看,首先要分成3层,红色区域代表辅助层(轴、标注、辅助线、图例等)、绿色区域图表层(折线、曲线等)、蓝色区域标签层(label数据展示卡片等)。为什么要分层,就是为了后期管理图层能更容易,不然做个动画、清理画布也是很麻烦的事情。
如何做适配
这里有个细节就是canvas一定要设置width、height而不是canvas.style.width,在窗口缩放场景下会有问题。这是最关键的一点,其次我们传入的axisX和axisY的data一定要知道他只是个份数,我们要映射到的是份数,这样比如1000px宽的屏幕,我们取10份是100px、500px的屏幕,取10份是50px。我们一般只要考虑宽度的缩放。
考虑缩放
  // 计算 Y 轴坐标比例尺 ratioY
  maxY = Math.max.apply(null, concatData);
  minY = Math.min.apply(null, concatData);
  rangeY = maxY - minY;
  // 数据和坐标范围的比值
  ratioY = (height - 2 * margin) / rangeY;
  // 计算 X 轴坐标比例尺和步长
  count = concatData.length;
  rangeX = width - 2 * margin;
  xk = 1, xkVal = xk * margin
  dataLen = data.length
  ratioX = rangeX / (count - dataLen);
  stepX = ratioX;

绘制坐标轴
/**
 * 绘制坐标轴
 */
function drawAxis() {
  ctx.beginPath();
  ctx.moveTo(margin, margin);
  ctx.lineTo(margin, height - margin);
  ctx.lineTo(width - margin + 2, height - margin);
  ctx.setLineDash([3, 3])
  ctx.strokeStyle = '#aaa'
  ctx.stroke();
  ctx.setLineDash([1])
  const yLen = newOpt.axisY.data.length
  const xLen = newOpt.axisX.data.length

  // 绘制 Y 轴坐标标记和标签
  for (let i = 0; i < yLen; i++) {
    let y = (rangeY * i) / (yLen - 1) + minY;
    let yPos = height - margin - (y - minY) * ratioY;

    if (i) {
      ctx.beginPath();
      ctx.moveTo(margin, yPos);
      ctx.lineTo(width - margin, yPos);
      ctx.strokeStyle = '#ddd'
      ctx.stroke();
    }

    ctx.beginPath();
    ctx.stroke();
    newYs = []
    for (const val of options.axisY.data) {
      newYs.push(options.axisY.format(val))
    }
    ctx.fillText(newYs[i] + '', margin - 15 - options.axisY.right, yPos + 5);
    firstEnding && axisYList.push(yPos + 5)
  }

  // 绘制 X 轴坐标标签
  for (let i = 0; i < xLen; i++) {
    let x = i * stepX;
    let xPos = (margin + x);
    if (i) {
      ctx.beginPath();
      ctx.moveTo(xPos, height - margin);
      ctx.lineTo(xPos, margin);
      ctx.strokeStyle = '#ddd'
      ctx.stroke();
    }
    newXs = []
    for (const val of options.axisX.data) {
      newXs.push(options.axisX.format(val))
    }
    ctx.fillText(newXs[i], xPos - 1, height - margin + 10 + options.axisX.top);
    firstEnding && axisXList.push(xPos - 1)
  }
}
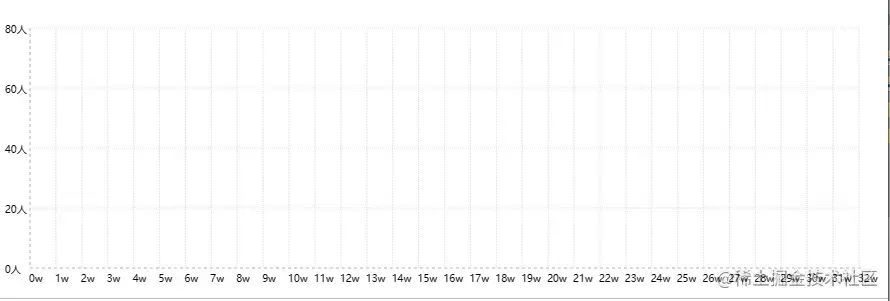
绘制曲线入口
/**
 * 绘制单组曲线
 * @param data
 */
function drawLine(data: any) {
  const { points, id, rgba, lineColor, hoverRgba } = data
  startAreaX = endAreaX
  startAreaY = endAreaY
  // 分割区
  if (firstEnding) {
    areaList.push({ x: startAreaX, y: startAreaY })
  }

  function darwColorOrLine(lineMode: boolean) {
    // 绘制折线
    ctx.beginPath();
    ctx.moveTo(id ? margin + endAreaX - xkVal : margin + endAreaX, height - margin - (points[0] - minY) * ratioY);
    ctx.lineWidth = 2
    ctx.setLineDash([0, 0])

    let x = 0, y = 0, translateX = 0
    if (id) {
      translateX -= 20
    }
    for (let i = 0; i < points.length; i++) {
      x = i * stepX + margin + endAreaX + translateX
      y = height - margin - (points[i] - minY) * ratioY;

      let x0 = (i - 1) * stepX + margin + endAreaX + translateX;
      let y0 = height - margin - (points[i - 1] - minY) * ratioY;
      let xc = x0 + stepX / 2;
      let yc = (y0 + y) / 2;
      if (i === 0) {
        prePointPosX = x
        prePointPosY = y
        ctx.lineTo(x, y);
        // 这里需要提前考虑是否是线、还是曲线
        if (!(prePointPosX === x && prePointPosY === y)) {
          pointList.push({ type: 'line', start: { x: prePointPosX, y: prePointPosY }, end: { x: x, y: y } })
        }
      } else {
        ctx.bezierCurveTo(xc, y0, xc, y, x, y);
        pointList.push({ type: 'curve', start: { x: prePointPosX, y: prePointPosY }, end: { x: x, y: y }, control1: { x: xc, y: y0 }, control2: { x: xc, y: y } })
      }
      prePointPosX = x
      prePointPosY = y
      if (i === points.length - 1) {
        endAreaX = x
        endAreaY = y

        if (firstEnding && id === newOpt.data.length - 1) {
          areaList.push({ x: x, y: y })
        }
      }
    }
    ctx.strokeStyle = lineColor
    ctx.stroke()

    lineMode && ctx.beginPath()

    // 右侧闭合点
    ctx.lineTo(endAreaX, height - margin)
    // 左侧闭合点
    ctx.lineTo(margin + startAreaX, height - margin)
    let startClosePointX = id ? startAreaX : margin + startAreaX
    // 交接闭合点
    ctx.lineTo(startClosePointX, height - margin)
    ctx.strokeStyle = 'transparent'
    lineMode && ctx.stroke();
  }
  darwColorOrLine(false)
  // 渐变
  const gradient = ctx.createLinearGradient(200, 110, 200, 290);

  if (isHover && areaId === id) {
    gradient.addColorStop(0, `rgba(${hoverRgba[1][0]}, ${hoverRgba[1][1]}, ${hoverRgba[1][2]}, 1)`);
    gradient.addColorStop(1, `rgba(${hoverRgba[0][0]}, ${hoverRgba[0][1]}, ${hoverRgba[0][2]}, 1)`);
  } else {
    gradient.addColorStop(0, `rgba(${rgba[1][0]}, ${rgba[1][1]}, ${rgba[1][2]}, 1)`);
    gradient.addColorStop(1, `rgba(${rgba[0][0]}, ${rgba[0][1]}, ${rgba[0][2]}, 0)`);
  }

  ctx.fillStyle = gradient;
  ctx.fill();
}
/**
 * 绘制所有组的曲线
 */
function startDrawLines() {
  const { data, series } = newOpt
  for (let i = 0; i < data.length; i++) {
    drawLine({ points: data[i], id: i, rgba: series[i].rgba, hoverRgba: series[i].hoverRgba, lineColor: series[i].lineColor })
  }
  firstEnding = false  //由于是不断绘制,我们需要得到第一次渲染完的我们想要的数组,防止数据被污染
}
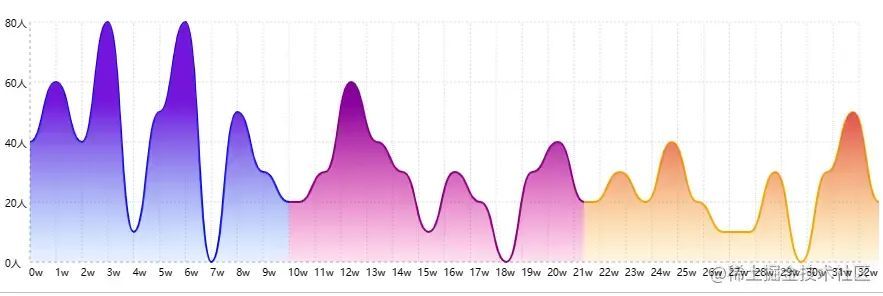
这里要注意的是我们的分区一定是线段的闭合,然后通过fillStyle填充颜色。所以你需要在结束点后再lineTo做3次到我的起始点。addColorStop来做渐变。
绘制贝塞尔曲线
x = i * stepX + margin + endAreaX + translateX
y = height - margin - (points[i] - minY) * ratioY;
let x0 = (i - 1) * stepX + margin + endAreaX + translateX;
let y0 = height - margin - (points[i - 1] - minY) * ratioY;
let xc = x0 + stepX / 2;
let yc = (y0 + y) / 2;
// ....
ctx.bezierCurveTo(xc, y0, xc, y, x, y);
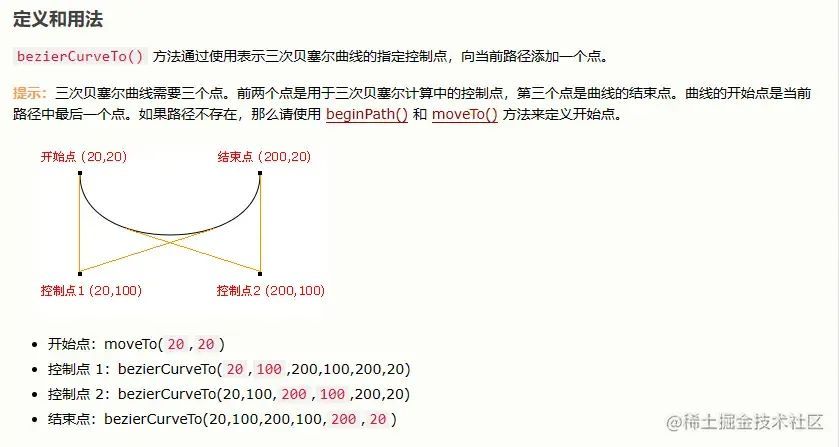
具体api不过多阐述,但是我们要知道一个控制点我们的曲线是只有一个方向的,如果两个控制点,意味着我们曲线可以最多有2个方向。而我们的图表是分上下需要平滑过渡过去的,这个时候必须用两个控制点的。
bezierCurveTo原理
要想实现bezierCurveTo,其实就是计算得到路径经过的所有点,而这个更方便我们后期在路径上的点的获取。下面的计算会比较复杂,其实就是套用三次贝塞尔曲线的公式罢了
function getBezierCurvePoints(startX: number, startY: number, cp1X: number, cp1Y: number, cp2X: number, cp2Y: number, endX: number, endY: number, steps: number) {
  let points = [];

  // 使用二次贝塞尔曲线近似三次贝塞尔曲线
  let q1x = startX + (cp1X - startX) * 2 / 3;
  let q1y = startY + (cp1Y - startY) * 2 / 3;
  let q2x = endX + (cp2X - endX) * 2 / 3;
  let q2y = endY + (cp2Y - endY) * 2 / 3;

  // 采样曲线上的所有点
  for (let i = 0; i <= steps; i++) {
    let t = i / steps;
    let x = (1 - t) * (1 - t) * (1 - t) * startX +
      3 * t * (1 - t) * (1 - t) * q1x +
      3 * t * t * (1 - t) * q2x +
      t * t * t * endX;
    let y = (1 - t) * (1 - t) * (1 - t) * startY +
      3 * t * (1 - t) * (1 - t) * q1y +
      3 * t * t * (1 - t) * q2y +
      t * t * t * endY;

    points.push({ x: +x.toFixed(2), y: +y.toFixed(2) });
  }

  return points;
}
三次贝塞尔曲线的公式原理
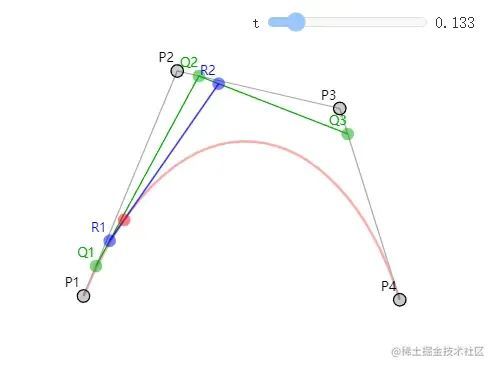
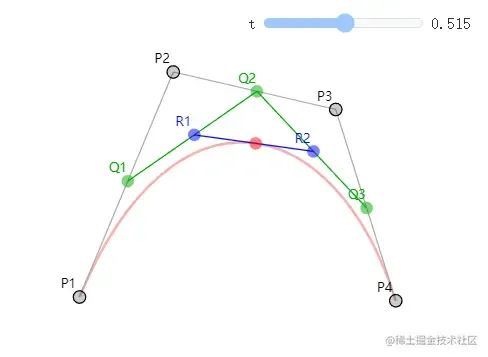
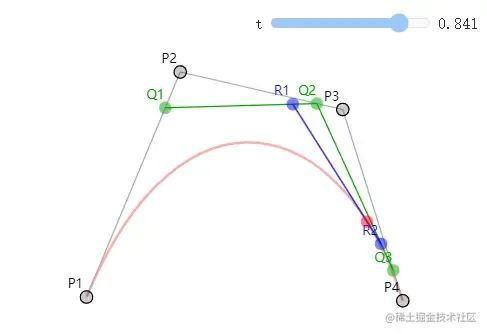
公式的推导数学好的大佬可以研究研究,但是他的计算过程还是要知道的,我们可以看到t的值从0到1代表曲线的开始端点和结束端点。t控制着Q1、Q2、Q3的百分比的分别在p1p2、p2p3、p3p4线段的位置,同理也是r1、r2对应的位置,然后再得出r1和r2中的相对位置。所以根本就是t的偏移量在不断划分的线段中的位置。t从0到1的所有的点的集合就是构造曲线的集合。
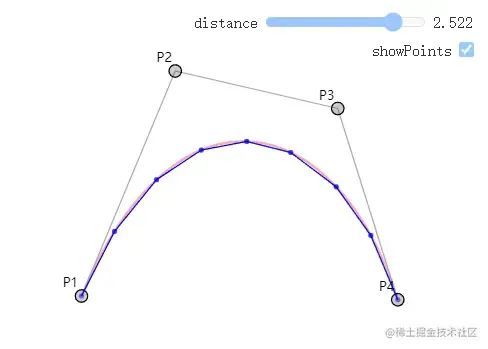
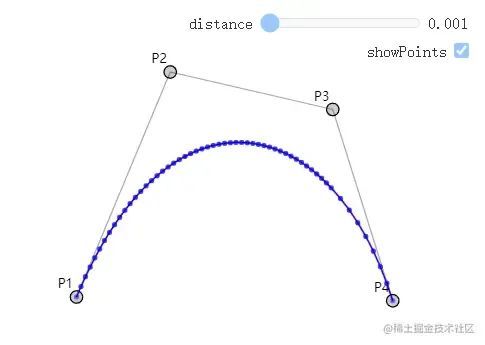
同时我们根据这个原理,通过Ramer Douglas Peucker 算法[1]可以得出线段的细分,控制曲线是否圆滑。
如何实现点在路径上游走

我们之前能得到曲线上的所有点,只要计算我的clientX是否在路径点的集合中对应的那个点筛选出来,然后在遮罩层绘制一个圆圈以及辅助线。
function getAllPoints(segments: PointList) {
  let points = [];
  let lastPoint = null;

  // 遍历所有线段的控制点和终点,将这些点的坐标存储到数组中
  for (let i = 0; i < segments.length; i++) {
    let segment = segments[i];
    let pointsCount = 50; // 点的数量
    // 如果是直线,则使用lineTo方法连接线段的终点
    if (segment.type === "line") {
      let x0 = segment.start.x;
      let y0 = segment.start.y;
      let x1 = segment.end.x;
      let y1 = segment.end.y;
      for (let j = 0; j <= pointsCount; j++) {
        let t = j / pointsCount;
        let x = x0 + (x1 - x0) * t;
        let y = y0 + (y1 - y0) * t;
        points.push({ x: +x.toFixed(2), y: +y.toFixed(2) });
      }
      // 如果是曲线,则使用贝塞尔曲线的方法绘制曲线,并将曲线上的所有点的坐标存储到数组中
    } else if (segment.type === "curve") {
      let x0 = segment.start.x;
      let y0 = segment.start.y;
      let x1 = segment.control1.x;
      let y1 = segment.control1.y;
      let x2 = segment.control2.x;
      let y2 = segment.control2.y;
      let x3 = segment.end.x;
      let y3 = segment.end.y;
      const point = getBezierCurvePoints(x0, y0, x1, y1, x2, y2, x3, y3, pointsCount)
      points.push(...point);
    }
    // 更新线段的起点
    lastPoint = segment.end;
  }
  return points
}
label的数据计算、区间的计算

我们可以看到填充色和label的数值都已经变化,这里需要监听下全局的坐标是否在图表内,如果在内部,就计算pointX = clientX \- dom.offsetLeft \- dom.margin, y坐标同理。
/**
 * label显示
 * @param clientX
 * @param clientY
 */
function drawTouchPoint(clientX: number, clientY: number) {
  cx = clientX, cy = clientY

  // 计算当前区间位置
  for (let i = 0; i < areaList.length - 1; i++) {
    const pre = areaList[i].x;
    const after = areaList[i + 1].x;

    if (cx > pre && cx < after) {
      areaId = i
    }
  }
  // 计算交叉位置,得到对应的x轴位置,从option的data中取对应的title
  for (let i = 0; i < axisXList.length - 1; i++) {
    const pre = axisXList[i];
    const after = axisXList[i + 1];
    if (cx > pre && cx < after) {
      curInfo.x = i
    }
  }
  for (let i = 0; i < axisYList.length - 1; i++) {
    const max = axisYList[i];
    const min = axisYList[i + 1];
    if (cy < max && cy > min) {
      curInfo.y = i + 1
    }
  }

  let crossPoint = pathPoints.find((item: Pos) => {
    const orderNum = .5
    if (Math.abs(item.x - clientX) <= orderNum) {
      return item
    }
  }) as Pos | undefined
  if (crossPoint && canvas) {
    dotCtx.clearRect(0, 0, canvas.width, canvas.height);

    dotCtx.beginPath()
    dotCtx.setLineDash([2, 4]);
    dotCtx.moveTo(crossPoint.x, margin)
    dotCtx.lineTo(crossPoint.x, height - margin)
    dotCtx.strokeStyle = '#000'
    dotCtx.stroke()

    drawArc(dotCtx, crossPoint.x, crossPoint.y, 5)

    //label
    if (!isLabel) {
      labelDOM = document.createElement("div");
      labelDOM.id = 'canvasTopBox'
      labelDOM.innerHTML = ""
      container && container.appendChild(labelDOM)
      isLabel = true
    } else {
      if (labelDOM) {
        let t = crossPoint.y + labelDOM.offsetHeight > canvas.height - margin ? canvas.height - margin - labelDOM.offsetHeight : crossPoint.y - labelDOM.offsetHeight * .5
        labelDOM.style.left = crossPoint.x + 20 + 'px'
        labelDOM.style.top = t + 'px'
        labelDOM.innerHTML = `
         <div class='label'>
           <div class='label-left' style='backGround: ${newOpt.series[areaId].lineColor}'>
           </div>
          <div class='label-right'>
            <div class='label-text'>人数:${newYs[curInfo.y]} </div>
            <div class='label-text'>订单数:${newXs[curInfo.x]} </div>
          </div>
         </div>
        `
      } else {
      }
    }
  }
}
遮罩动画
核心原理就是通过clearRect,下面的代码是从右向左遮罩,所以这里可以直接transfrom: rotate(-180deg)就可以了。
function drawAnimate() {
  markCtx.clearRect(0, 0, width, height);

  markCtx.fillStyle = "rgba(255, 255, 255, 1)"
  markCtx.fillRect(0, 0, width, height);

  markCtx.clearRect(
    (width - maskWidth),
    (height - maskHeight),
    maskWidth,
    maskHeight
  );

  // 更新遮罩区域大小
  maskWidth += 20;
  maskHeight += 20;
  if (maskWidth < width) {
    animateId = requestAnimationFrame(drawAnimate);
  } else {
    cancelAnimationFrame(animateId)
    watchEvent()
  }
}
option配置入口
export const options = {
  layout: {
    w: 0,
    h: 0,
    root: '#container',
    m: 30
  },
  data: [[40, 60, 40, 80, 10, 50, 80, 0, 50, 30, 20], [20, 30, 60, 40, 30, 10, 30, 20, 0, 30, 40, 20], [20, 30, 20, 40, 20, 10, 10, 30, 0, 30, 50, 20]],
  axisX: {
    data: [0, 1, 2, 3, 4, 5, 6, 7, 8, 9, 10, 11, 12, 13, 14, 15, 16, 17, 18, 19, 20, 21, 22, 23, 24, 25, 26, 27, 28, 29, 30, 31, 32],
    format(param: string | number) {
      return param + 'w'
    },
    top: 4,
  },
  axisY: {
    data: [0, 20, 40, 60, 80],
    format(param: string | number) {
      return param + '人'
    },
    right: 10,
  },
  series: [
    {
      rgba: [[55, 162, 255], [116, 21, 219]],
      hoverRgba: [[55, 162, 255], [116, 21, 219]],
      lineColor: 'blue'
    },
    {
      rgba: [[255, 0, 135], [135, 0, 157]],
      hoverRgba: [[255, 0, 135], [135, 0, 157]],
      lineColor: 'purple'
    },
    {
      rgba: [[255, 190, 0], [224, 62, 76]],
      hoverRgba: [[255, 190, 0], [224, 62, 76]],
      lineColor: 'orange'
    }
  ]
}
总结
canvas的核心就是点的处理,在一些曲线衔接、路径的获取会比较复杂,同时如何管理好图层是很重要的,本曲线图底部是辅助图层不做变化,曲线是需要做动画的话,最好就单独做个图层,顶部在来个遮罩做标签等元素,为了更方便做自定义,我们也没必要用canvas绘制,直接dom或svg渲染就行。
参考资料
[1]
Ramer Douglas Peucker 算法: https://en.wikipedia.org/wiki/Ramer%E2%80%93Douglas%E2%80%93Peucker_algorithm
- EOF -
作者:谦宇
https://juejin.cn/post/7224886702883258424