目录
- 这是开头
- 开发时间
- 准备工作
- 中间的白色竖线
- 时间刻度
- 鼠标移动时显示所在时间
- 拖动时间轴
- 调整时间分辨率
- 绘制时间段
- 多个时间轴
- 显示自定义元素
- 总结
这是开头
本文给大家带来一个时间轴的组件开发教程,话不多说,先看动图:
主要功能就是可以拖动时间轴来定位当前时间,可以通过鼠标滚轮来修改当前时间分辨率,也支持显示时间段功能,动图未体现,可看下面的本次demo效果示例:

如果对canvas不太熟悉的话可以先看一下教程:https://www.runoob.com/tags/ref-canvas.html
接下来进入开发时间。
开发时间
前端框架依旧使用的是vue,这个组件交互是通过canvas实现的,模板非常简单:
| <template> | |
| <div class="timeLineContainer" ref="timeLineContainer"> | |
| <canvas | |
| ref="canvas" | |
| @mousemove="onMousemove" | |
| @mouseout="onMouseout" | |
| @mousedown="onMousedown" | |
| @mousewheel="onMouseweel" | |
| ></canvas> | |
| </div> | |
| </template> |
绑定了四个事件,后续再细说。
准备工作
首先要做的是设置一下画布的宽高及获取画图上下文:
| { | |
| methods: { | |
| init () { | |
| // 获取外层宽高 | |
| let { | |
| width, | |
| height | |
| } = this.$refs.timeLineContainer.getBoundingClientRect() | |
| this.width = width | |
| this.height = height | |
| // 设置画布宽高为外层元素宽高 | |
| this.$refs.canvas.width = width | |
| this.$refs.canvas.height = height | |
| // 获取画图上下文 | |
| this.ctx = this.$refs.canvas.getContext('2d') | |
| } | |
| } | |
| } |
中间的白色竖线
中间的白色竖线代表的就是当前的时间,但是就线而言它只是一条线,所以先把它画了:
| { | |
| // 这个函数是整个绘制方法,所有的绘制方法都在此调用 | |
| draw () { | |
| this.drawMiddleLine() | |
| }, | |
| // 画中间的白色竖线 | |
| drawMiddleLine () { | |
| let lineWidth = 2 | |
| // 线的x坐标是时间轴的中点,y坐标即时间轴的高度 | |
| let x = this.width / 2 | |
| this.drawLine(x, 0, x, this.height, lineWidth, '#fff') | |
| }, | |
| // 画线段方法 | |
| drawLine (x1, y1, x2, y2, lineWidth = 1, color = '#fff') { | |
| // 开始一段新路径 | |
| this.ctx.beginPath() | |
| // 设置线段颜色 | |
| this.ctx.strokeStyle = '#fff' | |
| // 设置线段宽度 | |
| this.ctx.lineWidth = lineWidth | |
| // 将路径起点移到x1,y1 | |
| this.ctx.moveTo(x1, y1) | |
| // 将路径移动到x2,y2 | |
| this.ctx.lineTo(x2, y2) | |
| // 把路径画出来 | |
| this.ctx.stroke() | |
| } | |
| } |
这样白色竖线就有了:

时间刻度
时间刻度是本组件的核心,支持调整时间分辨率(就是整个时间轴所表示的时间范围,也即每两刻度之间的一格代表的时间大小),暂定包含0.5, 1, 2, 6, 12, 24这五种,单位是小时,先定义几个变量:
| // 一小时的毫秒数 | |
| const ONE_HOUR_STAMP = 60 * 60 * 1000 | |
| // 时间分辨率 | |
| const ZOOM = [0.5, 1, 2, 6, 12, 24] | |
| export default { | |
| data () { | |
| return { | |
| // 当前所在时间分辨率的类型索引 | |
| currentZoomIndex: 5, | |
| // 当前时间 | |
| currentTime: 0, | |
| // 时间轴左侧起点所代表的时间,默认为当天的0点减12小时,即昨天中午12点 | |
| startTimestamp: | |
| new Date(moment().format('YYYY-MM-DD 00:00:00')).getTime() - | |
| 12 * ONE_HOUR_STAMP, | |
| } | |
| } | |
| } |
时间分辨率放在ZOOM的数组里,先以24分辨率来开发,24代表的是整个时间轴表示的时间范围为24小时。但是具体用一格表示多久呢,可以1个小时1格,也可以半个小时一格,随便你,这里就用一格表示半个小时,其他分辨率也是如此,为了方便也把它们装到一个数组里:
| // 时间分辨率对应的每格小时数 | |
| const ZOOM_HOUR_GRID = [1 / 60, 1 / 60, 2 / 60, 1 / 6, 0.25, 0.5] |
0.5就代表1小格代表0.5个小时,既然每格代表的小时数知道了,那么时间轴一共需要画多少格也就确定了:
| // 一共可以绘制的格数,时间轴的时间范围小时数除以每格代表的小时数,24/0.5=48 | |
| let gridNum = ZOOM[this.currentZoomIndex] / ZOOM_HOUR_GRID[this.currentZoomIndex] |
因为时间计算都是通过毫秒进行计算,所以先算一下一格代表多少毫秒:
| // 一格多少毫秒,将每格代表的小时数转成毫秒数就可以了 | |
| let msPerGrid = ZOOM_HOUR_GRID[this.currentZoomIndex] * ONE_HOUR_STAMP |
接下来是关键,因为要画图,最终还是要知道像素大小,那么每格是多少像素呢:
| // 每格宽度,时间轴的宽度除以总格数 | |
| let pxPerGrid = this.width / gridNum |
接下来事情似乎就简单了,循环一下画出刻度就好了:
| for (let i = 0; i < gridNum; i++) { | |
| // 横坐标就是当前索引乘每格宽度 | |
| let x = i * pxPerGrid | |
| // 当前刻度的时间,时间轴起始时间加上当前格子数乘每格代表的毫秒数 | |
| let graduationTime = this.startTimestamp + i * msPerGrid | |
| // 刻度高度为时间轴高度的20% | |
| let h = this.height * 0.2 | |
| // 刻度线颜色 | |
| this.ctx.fillStyle = 'rgba(151,158,167,1)' | |
| // 显示时间 | |
| this.ctx.fillText( | |
| this.graduationTitle(graduationTime), | |
| x - 13,// 向左平移一半 | |
| h + 15// 加上行高 | |
| ) | |
| this.drawLine(x, 0, x, h, 1, 'rgba(151,158,167,1)') | |
| } |
graduationTitle方法是用来格式时间的,在0点时显示日期而不是时间:
| graduationTitle (datetime) { | |
| let time = moment(datetime) | |
| // 0点则显示当天日期 | |
| if ( | |
| time.hours() === 0 && | |
| time.minutes() === 0 && | |
| time.milliseconds() === 0 | |
| ) { | |
| return time.format('MM-DD') | |
| } else {// 否则显示小时和分钟 | |
| return time.format('HH:mm') | |
| } | |
| } |
看下效果:

似乎很完美,但是这样的真的可以了吗?不妨把起始时间加上个15分钟看一下:
| startTimestamp: | |
| new Date(moment().format('YYYY-MM-DD 00:00:00')).getTime() - | |
| 12 * ONE_HOUR_STAMP + | |
| 15 * 60 * 1000// 加15分钟 |
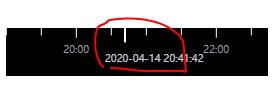
起始时间加上15分钟,则为12:15分,看下效果:

可以看到,虽然每格代表的还是半个小时,但是我们的要求应该是逢整点和半点才显示刻度的,所以起始点应该是处在12:00和12:30分两根刻度的中间才对,所以画刻度的位置就需要加上一个偏移量,这里的偏移量很明显就是12:30-12:15=15分钟,如果起始点是12:40,那么偏移量就是13:00-12:40=20分钟,那么怎么算呢?我们不妨把时间拖回到0点,从0开始也许更容易看出来:
比如间距为10,起始点为5,那么与0的偏移量当然是5,可以通过5-0也可以通过5%10来算出来,那如果起始点是14,与前一个点的偏移量是14-10=4,但问题是你不知道前一个点是多少,所以减不了,只能14%10=4来算。但是我们实际需要的是与后一个点的偏移量,很简单,间距减去它就可以了。

其实很多差距的计算都可以通过取余来算,所以:
| // 时间偏移量,初始时间除每格时间取余数, | |
| let msOffset = msPerGrid - (this.startTimestamp % msPerGrid) | |
| // 距离偏移量,时间偏移量和每格时间比例乘每格像素 | |
| let pxOffset = (msOffset / msPerGrid) * pxPerGrid | |
| for (let i = 0; i < gridNum; i++) { | |
| let x = pxOffset + i * pxPerGrid | |
| let graduationTime = this.startTimestamp + msOffset + i * msPerGrid | |
| //... | |
| } |
效果如下:

但是这样每个刻度都显示时间没必要也有点丑,所以可以循环的时候加个判断条件来选择性的绘制,因为每种分辨率也有不同的判断条件,所以也用一个数组来表示:
| // 时间分辨率对应的时间显示判断条件 | |
| const ZOOM_DATE_SHOW_RULE = [ | |
| () => {// 全都显示 | |
| return true | |
| }, | |
| date => {// 每五分钟显示 | |
| return date.getMinutes() % 5 === 0 | |
| }, | |
| date => {// 显示10、20、30...分钟数 | |
| return date.getMinutes() % 10 === 0 | |
| }, | |
| date => {// 显示整点和半点小时 | |
| return date.getMinutes() === 0 || date.getMinutes() === 30 | |
| }, | |
| date => {// 显示整点小时 | |
| return date.getMinutes() === 0 | |
| }, | |
| date => {// 显示2、4、6...整点小时 | |
| return date.getHours() % 2 === 0 && date.getMinutes() === 0 | |
| } | |
| ] | |
| for (let i = 0; i < gridNum; i++) { | |
| let x = pxOffset + i * pxPerGrid | |
| let graduationTime = this.startTimestamp + msOffset + i * msPerGrid | |
| let h = 0 | |
| let date = new Date(graduationTime) | |
| // 0点显示日期 | |
| if (date.getHours() === 0 && date.getMinutes() === 0) { | |
| h = this.height * 0.3 | |
| this.ctx.fillStyle = 'rgba(151,158,167,1)' | |
| this.ctx.fillText( | |
| this.graduationTitle(graduationTime), | |
| x - 13, | |
| h + 15 | |
| ) | |
| } else if (ZOOM_DATE_SHOW_RULE[this.currentZoomIndex](date)) {// 其他根据判断条件来显示 | |
| h = this.height * 0.2 | |
| this.ctx.fillStyle = 'rgba(151,158,167,1)' | |
| this.ctx.fillText( | |
| this.graduationTitle(graduationTime), | |
| x - 13, | |
| h + 15 | |
| ) | |
| } else {// 其他不显示时间 | |
| h = this.height * 0.15 | |
| } | |
| this.drawLine(x, 0, x, h, 1, 'rgba(151,158,167,1)') | |
| } |
效果如下:

鼠标移动时显示所在时间
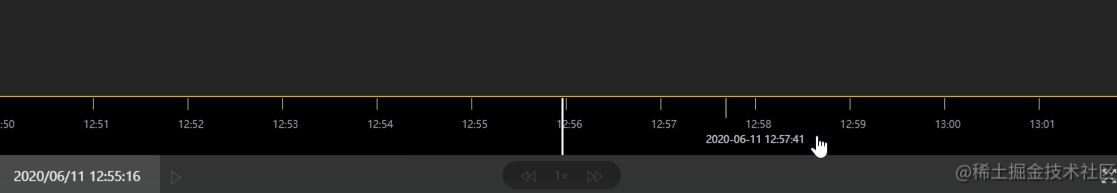
鼠标在时间轴上滑动时需要实时显示鼠标所在位置的时间,效果如下:
实现方式就是获取到鼠标相对画布的位置,然后换算成距起始点的时间:
| { | |
| // 最开始就绑定的鼠标移动事件 | |
| onMousemove (e) { | |
| // 计算出相对画布的位置 | |
| let { left } = this.$refs.canvas.getBoundingClientRect() | |
| let x = e.clientX - left | |
| // 计算出时间轴上每毫秒多少像素 | |
| const PX_PER_MS = | |
| this.width / (ZOOM[this.currentZoomIndex] * ONE_HOUR_STAMP) // px/ms | |
| // 计算所在位置的时间 | |
| let time = this.startTimestamp + x / PX_PER_MS | |
| // 清除画布 | |
| this.clearCanvas(this.width, this.height) | |
| // 绘制 | |
| this.draw() | |
| // 绘制实时的竖线及时间 | |
| this.drawLine(x, 0, x, this.height * 0.3, 'rgb(194, 202, 215)', 1) | |
| this.ctx.fillStyle = 'rgb(194, 202, 215)' | |
| this.ctx.fillText( | |
| moment(time).format('YYYY-MM-DD HH:mm:ss'), | |
| x - 20, | |
| this.height * 0.3 + 20 | |
| ) | |
| } | |
| } |
拖动时间轴
万众瞩目的焦点来了,时间轴时间轴,当然得需要能拖动,不然那叫时间段,从效果上看好像是鼠标拖着时间轴在滑动,但是实际上并没有,跟动画类似,就是不断的刷新重绘,因为人眼的暂存效应,看起来就像在滑动一样,而时间轴渲染的依据就是起始时间点,所以本质上就是计算鼠标拖动过程中的起始时间点是多少,先看一下鼠标按下的事件处理函数:
| onMousedown (e) { | |
| let { left } = this.$refs.canvas.getBoundingClientRect() | |
| // 也是计算鼠标相当于时间轴左侧的距离 | |
| this.mousedownX = e.clientX - left | |
| // 设置一下标志位 | |
| this.mousedown = true | |
| // 缓存一下鼠标按下时的起始时间点 | |
| this.mousedownCacheStartTimestamp = this.startTimestamp | |
| } |
鼠标开始移动就又到了鼠标移动事件处理的那个函数:
| onMousemove (e) { | |
| let { left } = this.$refs.canvas.getBoundingClientRect() | |
| let x = e.clientX - left | |
| const PX_PER_MS = | |
| this.width / (ZOOM[this.currentZoomIndex] * ONE_HOUR_STAMP) // px/ms | |
| if (this.mousedown) { | |
| // 计算鼠标当前相当于鼠标按下那个点的距离 | |
| let diffX = x - this.mousedownX | |
| // 用鼠标按下时的起始时间点减去拖动过程中的偏移量,往左拖是负值,减减得正,时间就是在增加,往右拖时间就是在减少 | |
| this.startTimestamp = | |
| this.mousedownCacheStartTimestamp - Math.round(diffX / PX_PER_MS) | |
| // 不断刷新重绘就ok了 | |
| this.clearCanvas(this.width, this.height) | |
| this.draw() | |
| } else { | |
| // 鼠标滑动显示时间的逻辑 | |
| } |
调整时间分辨率
调整时间分辨率说白了就是调整时间轴所表示的时间范围,我们的范围是定义在ZOOM数组里的,所以通过鼠标滚动来调整之前定义的变量currentZoomIndex,然后重新渲染画布即可,需要注意的是时间范围调整了,而时间起始点不变的话那么当前时间就会变,但是我们一般是希望当前时间是不变的,所以需要调整时要计算新的时间起始点:
| onMouseweel (event) { | |
| let e = window.event || event | |
| let delta = Math.max(-1, Math.min(1, e.wheelDelta || -e.detail)) | |
| if (delta < 0) { | |
| // 缩小 | |
| if (this.currentZoomIndex + 1 >= ZOOM.length - 1) { | |
| this.currentZoomIndex = ZOOM.length - 1 | |
| } else { | |
| this.currentZoomIndex++ | |
| } | |
| } else if (delta > 0) { | |
| // 放大 | |
| if (this.currentZoomIndex - 1 <= 0) { | |
| this.currentZoomIndex = 0 | |
| } else { | |
| this.currentZoomIndex-- | |
| } | |
| } | |
| this.clearCanvas(this.width, this.height) | |
| // 重新计算起始时间点,当前时间-新的时间范围的一半 | |
| this.startTimestamp = | |
| this.currentTime - (ZOOM[this.currentZoomIndex] * ONE_HOUR_STAMP) / 2 | |
| this.draw() | |
| } |
绘制时间段
时间段就是在时间轴里带颜色的矩形块,先看看时间段的数据结构:
| [ | |
| { | |
| beginTime: new Date('2020-06-10 09:30:00').getTime(), | |
| endTime: new Date('2020-06-10 11:20:00').getTime(), | |
| style: { | |
| background: '#5881CF' | |
| } | |
| } | |
| ] |
接下来就是想办法把起始时间用给定的颜色在时间轴里画出来,首先要判断一下时间段是否在当前时间轴的范围内,如果不相交当然就不用画了:
| if (item.beginTime <= this.startTimestamp + ZOOM[this.currentZoomIndex] * ONE_HOUR_STAMP && item.endTime >= this.startTimestamp) { | |
| // 绘制范围内的线段 | |
| } |
绘制矩形用的是fillRect方法,它的四个参数分别是:x、y、width、height,先算起始点的坐标,y和height可以直接根据时间轴的高度来定,所以主要计算的就是x和width,x是起点值,可以用beginTime-startTimestamp再换算成像素就可以了,需要注意的是可能beginTime小于startTimestamp,负值显然是不行的,所以转成0,width就是起始时间的差值换算成像素,也需要注意小于0的情况,完整代码如下:
| drawTimeSegments () { | |
| const PX_PER_MS = | |
| this.width / (ZOOM[this.currentZoomIndex] * ONE_HOUR_STAMP) // px/ms | |
| this.timeSegments.forEach(item => { | |
| if ( | |
| item.beginTime <= | |
| this.startTimestamp + | |
| ZOOM[this.currentZoomIndex] * ONE_HOUR_STAMP && | |
| item.endTime >= this.startTimestamp | |
| ) { | |
| let x = (item.beginTime - this.startTimestamp) * PX_PER_MS | |
| let w | |
| if (x < 0) { | |
| x = 0 | |
| w = (item.endTime - this.startTimestamp) * PX_PER_MS | |
| } else { | |
| w = (item.endTime - item.beginTime) * PX_PER_MS | |
| } | |
| this.ctx.fillStyle = item.style.background | |
| this.ctx.fillRect(x, this.height * 0.6, w, this.height * 0.3) | |
| } | |
| }) | |
| } |
为什么endTime大于时间轴最大时间的情况不用特殊处理呢,因为不管也没关系,反正长度都已经超出范围了,再长一点短一点也看不到。

当然,这样单纯的显示一下时间段意义并不大,一般使用场景是代表在当前时间段内才有视频,所以可以在时间段存在的情况下对拖动时间做一下处理,如果拖动到的时间点不在任何一个时间段内,那么就让它吸附到离它最近的一个时间段的时间点上。
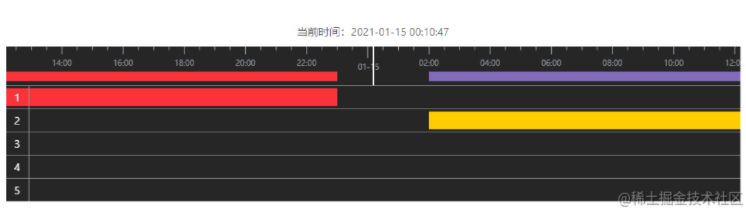
多个时间轴
一个时间轴往往是不够用的,比如同时要进行多路视频回放,每个视频都有自己的时间段,那么就需要多个时间轴来进行显示,这也很简单,我们把时间段相关的代码抽到一个单独的组件里,然后把内部状态都通过props进行传递,这样就可以进行复用了:
| <template> | |
| <div class="timeLineContainer" ref="timeLineContainer"> | |
| <canvas ref="canvas"></canvas> | |
| <!--多个时间轴--> | |
| <div class="windowList" ref="windowList" v-if="showWindowList && windowList && windowList.length > 1" @scroll="onWindowListScroll"> | |
| <WindowListItem | |
| v-for="(item, index) in windowListInner" | |
| ref="WindowListItem" | |
| :key="index" | |
| :index="index" | |
| :data="item" | |
| :totalMS="totalMS" | |
| :startTimestamp="startTimestamp" | |
| :width="width" | |
| :active="item.active" | |
| @click_window_timeSegments="triggerClickWindowTimeSegments" | |
| @click="toggleActive(index)" | |
| ></WindowListItem> | |
| </div> | |
| </div> | |
| </template> |
每个单独的时间轴也是一个canvas:
| // WindowListItem.vue | |
| <template> | |
| <div class="windowListItem" :class="{active: active}" ref="windowListItem" @click="onClick"> | |
| <span class="order">{{ index + 1 }}</span> | |
| <canvas class="windowListItemCanvas" ref="canvas"></canvas> | |
| </div> | |
| </template> |
效果如下:
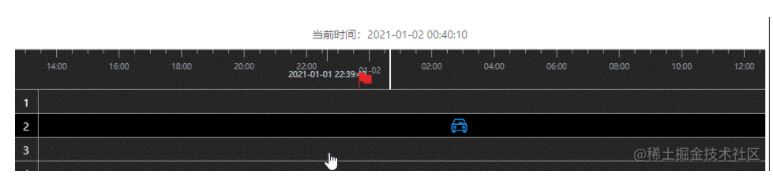
显示自定义元素
除了时间段,有时候我们会想在时间段上显示自定义元素,比如在某个时间点显示一张图片,因为时间轴是在动的,所以图片也得跟着动,这可以给使用者提供一个监听时间的功能,具体实现就是在上文的绘制方法draw里实时获取某个时间点的位置,然后抛出一个事件给使用者监听,使用者可以根据监听到的left、top值来定位元素。
获取某个时间点的位置也很简单,先判断这个时间点是否在当前显示的范围内,不在的话那显然就不用显示,在的话再换算成在当前时间轴上的位置,最后加上时间轴距离页面的位置即可:
| draw () { | |
| // ... | |
| // 更新观察的时间位置 | |
| this.updateWatchTime() | |
| } | |
| // 更新观察的时间位置 | |
| updateWatchTime () { | |
| this.watchTimeList.forEach((item) => { | |
| // 当前不在显示范围内 | |
| if (item.time < this.startTimestamp || item.time > this.startTimestamp + this.totalMS) { | |
| item.callback(-1, -1) | |
| } else { // 在范围内 | |
| let x = (item.time - this.startTimestamp) * (this.width / this.totalMS) | |
| let y = 0 | |
| let { left, top } = this.$refs.canvas.getBoundingClientRect() | |
| if (item.windowTimeLineIndex !== -1 && this.windowList.length > 1 && item.windowTimeLineIndex >= 0 && item.windowTimeLineIndex < this.windowList.length) { | |
| let rect = this.$refs.WindowListItem[item.windowTimeLineIndex].getRect() | |
| y = rect ? rect.top : top | |
| } else { | |
| y = top | |
| } | |
| item.callback(x + left, y) | |
| } | |
| }) | |
| } |
使用的时候,通过给你要显示的元素设置绝对定位或固定定位,然后监听时间的当前位置来修改元素的位置,如果时间轴本身的位置都变化了,比如页面滚动了,需要手动调用updateWatchTime方法来修正。
效果如下:
总结
本文介绍了如何实现一个视频时间轴组件,可以满足一些常见的场景,笔者也开发了一个可以直接使用的组件,文档:https://github.com/wanglin2/VideoTimeLine,如何不满足需求,也可以在此组件基础上进行定制。