目录
- 效果图:(移动上去也会有效果的那种哦)
- 第一步:vue中安装echarts和echarts-gl
- 第二步:在vue文件中引入
- 第三步:实现具体代码(完整的)
- 第四:我想说一下注意事项哈
- 总结
效果图:(移动上去也会有效果的那种哦)


第一步:vue中安装echarts和echarts-gl
| npm install echarts | |
| npm install echarts-gl |
注意:我不知道版本差异会不会有影响(可以指定版本 也可以借鉴我的)
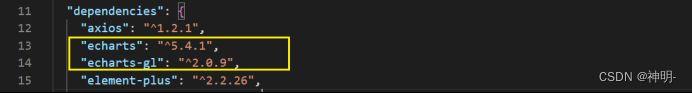
指定版本命令 加个@后面跟版本号即可
npm install echarts-gl@.0.9
成功之后可以在package.json中检查是否安装成功(如上图)
第二步:在vue文件中引入
引入位置:我没有在main.js中全局引用,而是哪个页面用到就引入哪里
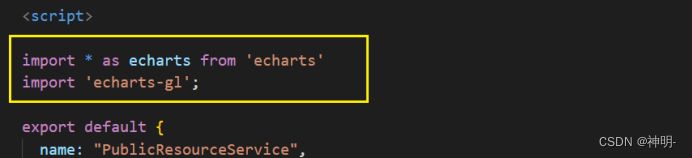
代码:
| import * as echarts from 'echarts' | |
| import 'echarts-gl'; |
第三步:实现具体代码(完整的)
注意:我没有封装起来(你也可以先直接在页面中实现,然后在考虑封装需求)
1、有一个装饼图的容器(可以都复制走 为了成功实现效果)
| <!-- 饼图 --> | |
| <div class="container"> | |
| <div class="chartsGl" id="charts"></div> | |
| <!-- 饼图下面的底座 --> | |
| <div class="buttomCharts"></div> | |
| </div> |
2、对应样式
| //饼图(外面的容器) | |
| .container { | |
| width:%; | |
| height:%; | |
| } | |
| //饼图的大小 | |
| .chartsGl { | |
| height:px; | |
| width:px; | |
| } | |
| //饼图底座(我也想给你们底座图片 可是我不知道咋给) | |
| .buttomCharts{ | |
| background: center top url(/src/assets/images/bg/buttom-charts.png) no-repeat; | |
| background-size: cover; | |
| height:px; | |
| width:px; | |
| margin-top: -px; | |
| margin-left:%; | |
| } |
3、饼图数据
| data() { | |
| return { | |
| //饼图数据+颜色 | |
| optionData: [ | |
| { | |
| name: '休闲室',//名称 | |
| value:,//值 | |
| itemStyle: {//颜色 紫色 | |
| color: 'rgba(, 167, 212,1)' | |
| } | |
| }, { | |
| name: '羽毛球室',//蓝色 | |
| value:, | |
| itemStyle: { | |
| color: 'rgba(, 195, 250,1)', | |
| } | |
| }, { | |
| name: '瑜伽室',//绿色 | |
| value:, | |
| itemStyle: { | |
| color: 'rgba(, 189, 107,1)' | |
| }}, | |
| { | |
| name: '动感单车室',//橙色 | |
| value:, | |
| itemStyle: { | |
| color: 'rgba(, 182, 94,1)' | |
| }} | |
| , | |
| { | |
| name: '兵乓球室',//黄色 | |
| value:, | |
| itemStyle: { | |
| color: 'rgba(, 222, 111,1)' | |
| }} | |
| ], | |
| } | |
| }, |
4、钩子中调用mouted
| mounted() { | |
| this.$nextTick(function() { | |
| this.init(); | |
| }); | |
| }, |
5、具体方法methods(为了你也方便修改样式 我注释尽量给到)
| //初始化构建 | |
| init() { | |
| //构建d饼状图 | |
| let myChart = echarts.init(document.getElementById('charts')); | |
| // 传入数据生成 option ; getPieD(数据,透明的空心占比(调节中间空心范围的0就是普通饼1就很镂空)) | |
| this.option = this.getPieD(this.optionData, 0.85); | |
| //将配置项设置进去 | |
| myChart.setOption(this.option); | |
| //鼠标移动上去特效效果 | |
| this.bindListen(myChart); | |
| }, | |
| //配置构建 pieData 饼图数据 internalDiameterRatio:透明的空心占比 | |
| getPieD(pieData, internalDiameterRatio) { | |
| let that = this; | |
| let series = []; | |
| let sumValue =; | |
| let startValue =; | |
| let endValue =; | |
| let legendData = []; | |
| let legendBfb = []; | |
| let k = - internalDiameterRatio; | |
| pieData.sort((a, b) => { | |
| return (b.value - a.value); | |
| }); | |
| // 为每一个饼图数据,生成一个 series-surface(参数曲面) 配置 | |
| for (let i =; i < pieData.length; i++) { | |
| sumValue += pieData[i].value; | |
| let seriesItem = { | |
| //系统名称 | |
| name: typeof pieData[i].name === 'undefined' ? `series${i}` : pieData[i].name, | |
| type: 'surface', | |
| //是否为参数曲面(是) | |
| parametric: true, | |
| //曲面图网格线(否)上面一根一根的 | |
| wireframe: { | |
| show: false | |
| }, | |
| pieData: pieData[i], | |
| pieStatus: { | |
| selected: false, | |
| hovered: false, | |
| k: k | |
| }, | |
| //设置饼图在容器中的位置(目前没发现啥用) | |
| // center: ['%', '100%'] | |
| }; | |
| //曲面的颜色、不透明度等样式。 | |
| if (typeof pieData[i].itemStyle != 'undefined') { | |
| let itemStyle = {}; | |
| typeof pieData[i].itemStyle.color != 'undefined' ? itemStyle.color = pieData[i].itemStyle.color : null; | |
| typeof pieData[i].itemStyle.opacity != 'undefined' ? itemStyle.opacity = pieData[i].itemStyle.opacity : null; | |
| seriesItem.itemStyle = itemStyle; | |
| } | |
| series.push(seriesItem); | |
| } | |
| // 使用上一次遍历时,计算出的数据和 sumValue,调用 getParametricEquation 函数, | |
| // 向每个 series-surface 传入不同的参数方程 series-surface.parametricEquation,也就是实现每一个扇形。 | |
| legendData = []; | |
| legendBfb = []; | |
| for (let i =; i < series.length; i++) { | |
| endValue = startValue + series[i].pieData.value; | |
| series[i].pieData.startRatio = startValue / sumValue; | |
| series[i].pieData.endRatio = endValue / sumValue; | |
| series[i].parametricEquation = this.getParametricEquation(series[i].pieData.startRatio, series[i].pieData.endRatio, | |
| false, false, k, series[i].pieData.value); | |
| startValue = endValue; | |
| let bfb = that.fomatFloat(series[i].pieData.value / sumValue,); | |
| legendData.push({ | |
| name: series[i].name, | |
| value: bfb | |
| }); | |
| legendBfb.push({ | |
| name: series[i].name, | |
| value: bfb | |
| }); | |
| } | |
| //(第二个参数可以设置你这个环形的高低程度) | |
| let boxHeight = this.getHeightD(series, 13);//通过传参设定3d饼/环的高度 | |
| // 准备待返回的配置项,把准备好的 legendData、series 传入。 | |
| let option = { | |
| //图例组件 | |
| legend: { | |
| data: legendData, | |
| //图例列表的布局朝向。 | |
| orient: 'horizontal', | |
| left:, | |
| top:, | |
| //图例文字每项之间的间隔 | |
| itemGap:, | |
| textStyle: { | |
| color: '#AE2FF', | |
| }, | |
| show: true, | |
| icon: "circle", | |
| //格式化图例文本(我是数值什么显示什么) | |
| formatter: function (name) { | |
| var target; | |
| for (var i =, l =pieData.length; i < l; i++) { | |
| if (pieData[i].name == name) { | |
| target = pieData[i].value; | |
| } | |
| } | |
| return `${name}: ${target}`; | |
| } | |
| // 这个可以显示百分比那种(可以根据你想要的来配置) | |
| // formatter: function(param) { | |
| // let item = legendBfb.filter(item => item.name == param)[]; | |
| // let bfs = that.fomatFloat(item.value *, 2) + "%"; | |
| // console.log(item.name) | |
| // return `${item.name} :${bfs}`; | |
| // } | |
| }, | |
| //移动上去提示的文本内容(我没来得及改 你们可以根据需求改) | |
| tooltip: { | |
| formatter: params => { | |
| if (params.seriesName !== 'mouseoutSeries' && params.seriesName !== 'pied') { | |
| let bfb = ((option.series[params.seriesIndex].pieData.endRatio - option.series[params.seriesIndex].pieData.startRatio) *).toFixed(2); | |
| return `${params.seriesName}<br/>` + | |
| `<span style="display:inline-block;margin-right:px;border-radius:10px;width:10px;height:10px;background-color:${params.color};"></span>` + | |
| `${ bfb }`; | |
| } | |
| } | |
| }, | |
| //这个可以变形 | |
| xAxisD: { | |
| min: -, | |
| max: | |
| }, | |
| yAxisD: { | |
| min: -, | |
| max: | |
| }, | |
| zAxisD: { | |
| min: -, | |
| max: | |
| }, | |
| //此处是修改样式的重点 | |
| gridD: { | |
| show: false, | |
| boxHeight: boxHeight, //圆环的高度 | |
| //这是饼图的位置 | |
| top: '-.5%', | |
| left:'-%', | |
| viewControl: { //d效果可以放大、旋转等,请自己去查看官方配置 | |
| alpha:, //角度(这个很重要 调节角度的) | |
| distance:,//调整视角到主体的距离,类似调整zoom(这是整体大小) | |
| rotateSensitivity:, //设置为0无法旋转 | |
| zoomSensitivity:, //设置为0无法缩放 | |
| panSensitivity:, //设置为0无法平移 | |
| autoRotate: false //自动旋转 | |
| } | |
| }, | |
| series: series | |
| }; | |
| return option; | |
| }, | |
| //获取d丙图的最高扇区的高度 | |
| getHeightD(series, height) { | |
| series.sort((a, b) => { | |
| return (b.pieData.value - a.pieData.value); | |
| }) | |
| return height * / series[0].pieData.value; | |
| }, | |
| // 生成扇形的曲面参数方程,用于 series-surface.parametricEquation | |
| getParametricEquation(startRatio, endRatio, isSelected, isHovered, k, h) { | |
| // 计算 | |
| let midRatio = (startRatio + endRatio) /; | |
| let startRadian = startRatio * Math.PI *; | |
| let endRadian = endRatio * Math.PI *; | |
| let midRadian = midRatio * Math.PI *; | |
| // 如果只有一个扇形,则不实现选中效果。 | |
| if (startRatio === && endRatio === 1) { | |
| isSelected = false; | |
| } | |
| // 通过扇形内径/外径的值,换算出辅助参数 k(默认值/3) | |
| k = typeof k !== 'undefined' ? k : / 3; | |
| // 计算选中效果分别在 x 轴、y 轴方向上的位移(未选中,则位移均为) | |
| let offsetX = isSelected ? Math.cos(midRadian) *.1 : 0; | |
| let offsetY = isSelected ? Math.sin(midRadian) *.1 : 0; | |
| // 计算高亮效果的放大比例(未高亮,则比例为) | |
| let hoverRate = isHovered ?.05 : 1; | |
| // 返回曲面参数方程 | |
| return { | |
| u: { | |
| min: -Math.PI, | |
| max: Math.PI *, | |
| step: Math.PI / | |
| }, | |
| v: { | |
| min:, | |
| max: Math.PI *, | |
| step: Math.PI / | |
| }, | |
| x: function(u, v) { | |
| if (u < startRadian) { | |
| return offsetX + Math.cos(startRadian) * ( + Math.cos(v) * k) * hoverRate; | |
| } | |
| if (u > endRadian) { | |
| return offsetX + Math.cos(endRadian) * ( + Math.cos(v) * k) * hoverRate; | |
| } | |
| return offsetX + Math.cos(u) * ( + Math.cos(v) * k) * hoverRate; | |
| }, | |
| y: function(u, v) { | |
| if (u < startRadian) { | |
| return offsetY + Math.sin(startRadian) * ( + Math.cos(v) * k) * hoverRate; | |
| } | |
| if (u > endRadian) { | |
| return offsetY + Math.sin(endRadian) * ( + Math.cos(v) * k) * hoverRate; | |
| } | |
| return offsetY + Math.sin(u) * ( + Math.cos(v) * k) * hoverRate; | |
| }, | |
| z: function(u, v) { | |
| if (u < -Math.PI *.5) { | |
| return Math.sin(u); | |
| } | |
| if (u > Math.PI *.5) { | |
| return Math.sin(u) * h * .; | |
| } | |
| return Math.sin(v) > ? 1 * h * .1 : -1; | |
| } | |
| }; | |
| }, | |
| //这是一个自定义计算的方法 | |
| fomatFloat(num, n) { | |
| var f = parseFloat(num); | |
| if (isNaN(f)) { | |
| return false; | |
| } | |
| f = Math.round(num * Math.pow(, n)) / Math.pow(10, n); // n 幂 | |
| var s = f.toString(); | |
| var rs = s.indexOf('.'); | |
| //判定如果是整数,增加小数点再补 | |
| if (rs <) { | |
| rs = s.length; | |
| s += '.'; | |
| } | |
| while (s.length <= rs + n) { | |
| s += ''; | |
| } | |
| return s; | |
| }, | |
| // 监听鼠标事件,实现饼图选中效果(单选),近似实现高亮(放大)效果。 | |
| bindListen(myChart) { | |
| let that = this; | |
| let selectedIndex = ''; | |
| let hoveredIndex = ''; | |
| // 监听点击事件,实现选中效果(单选) | |
| myChart.on('click', function(params) { | |
| // 从 option.series 中读取重新渲染扇形所需的参数,将是否选中取反。 | |
| let isSelected = !that.option.series[params.seriesIndex].pieStatus.selected; | |
| let isHovered = that.option.series[params.seriesIndex].pieStatus.hovered; | |
| let k = that.option.series[params.seriesIndex].pieStatus.k; | |
| let startRatio = that.option.series[params.seriesIndex].pieData.startRatio; | |
| let endRatio = that.option.series[params.seriesIndex].pieData.endRatio; | |
| // 如果之前选中过其他扇形,将其取消选中(对 option 更新) | |
| if (selectedIndex !== '' && selectedIndex !== params.seriesIndex) { | |
| that.option.series[selectedIndex].parametricEquation = that.getParametricEquation(that.option.series[ | |
| selectedIndex].pieData | |
| .startRatio, that.option.series[selectedIndex].pieData.endRatio, false, false, k, that.option.series[ | |
| selectedIndex].pieData | |
| .value); | |
| that.option.series[selectedIndex].pieStatus.selected = false; | |
| } | |
| // 对当前点击的扇形,执行选中/取消选中操作(对 option 更新) | |
| that.option.series[params.seriesIndex].parametricEquation = that.getParametricEquation(startRatio, endRatio, | |
| isSelected, | |
| isHovered, k, that.option.series[params.seriesIndex].pieData.value); | |
| that.option.series[params.seriesIndex].pieStatus.selected = isSelected; | |
| // 如果本次是选中操作,记录上次选中的扇形对应的系列号 seriesIndex | |
| isSelected ? selectedIndex = params.seriesIndex : null; | |
| // 使用更新后的 option,渲染图表 | |
| myChart.setOption(that.option); | |
| }); | |
| // 监听 mouseover,近似实现高亮(放大)效果 | |
| myChart.on('mouseover', function(params) { | |
| // 准备重新渲染扇形所需的参数 | |
| let isSelected; | |
| let isHovered; | |
| let startRatio; | |
| let endRatio; | |
| let k; | |
| // 如果触发 mouseover 的扇形当前已高亮,则不做操作 | |
| if (hoveredIndex === params.seriesIndex) { | |
| return; | |
| // 否则进行高亮及必要的取消高亮操作 | |
| } else { | |
| // 如果当前有高亮的扇形,取消其高亮状态(对 option 更新) | |
| if (hoveredIndex !== '') { | |
| // 从 option.series 中读取重新渲染扇形所需的参数,将是否高亮设置为 false。 | |
| isSelected = that.option.series[hoveredIndex].pieStatus.selected; | |
| isHovered = false; | |
| startRatio = that.option.series[hoveredIndex].pieData.startRatio; | |
| endRatio = that.option.series[hoveredIndex].pieData.endRatio; | |
| k = that.option.series[hoveredIndex].pieStatus.k; | |
| // 对当前点击的扇形,执行取消高亮操作(对 option 更新) | |
| that.option.series[hoveredIndex].parametricEquation = that.getParametricEquation(startRatio, endRatio, | |
| isSelected, | |
| isHovered, k, that.option.series[hoveredIndex].pieData.value); | |
| that.option.series[hoveredIndex].pieStatus.hovered = isHovered; | |
| // 将此前记录的上次选中的扇形对应的系列号 seriesIndex 清空 | |
| hoveredIndex = ''; | |
| } | |
| // 如果触发 mouseover 的扇形不是透明圆环,将其高亮(对 option 更新) | |
| if (params.seriesName !== 'mouseoutSeries' && params.seriesName !== 'pied') { | |
| // 从 option.series 中读取重新渲染扇形所需的参数,将是否高亮设置为 true。 | |
| isSelected = that.option.series[params.seriesIndex].pieStatus.selected; | |
| isHovered = true; | |
| startRatio = that.option.series[params.seriesIndex].pieData.startRatio; | |
| endRatio = that.option.series[params.seriesIndex].pieData.endRatio; | |
| k = that.option.series[params.seriesIndex].pieStatus.k; | |
| // 对当前点击的扇形,执行高亮操作(对 option 更新) | |
| that.option.series[params.seriesIndex].parametricEquation = that.getParametricEquation(startRatio, endRatio, | |
| isSelected, isHovered, k, that.option.series[params.seriesIndex].pieData.value +); | |
| that.option.series[params.seriesIndex].pieStatus.hovered = isHovered; | |
| // 记录上次高亮的扇形对应的系列号 seriesIndex | |
| hoveredIndex = params.seriesIndex; | |
| } | |
| // 使用更新后的 option,渲染图表 | |
| myChart.setOption(that.option); | |
| } | |
| }); | |
| // 修正取消高亮失败的 bug | |
| myChart.on('globalout', function() { | |
| // 准备重新渲染扇形所需的参数 | |
| let isSelected; | |
| let isHovered; | |
| let startRatio; | |
| let endRatio; | |
| let k; | |
| if (hoveredIndex !== '') { | |
| // 从 option.series 中读取重新渲染扇形所需的参数,将是否高亮设置为 true。 | |
| isSelected = that.option.series[hoveredIndex].pieStatus.selected; | |
| isHovered = false; | |
| k = that.option.series[hoveredIndex].pieStatus.k; | |
| startRatio = that.option.series[hoveredIndex].pieData.startRatio; | |
| endRatio = that.option.series[hoveredIndex].pieData.endRatio; | |
| // 对当前点击的扇形,执行取消高亮操作(对 option 更新) | |
| that.option.series[hoveredIndex].parametricEquation = that.getParametricEquation(startRatio, endRatio, | |
| isSelected, | |
| isHovered, k, that.option.series[hoveredIndex].pieData.value); | |
| that.option.series[hoveredIndex].pieStatus.hovered = isHovered; | |
| // 将此前记录的上次选中的扇形对应的系列号 seriesIndex 清空 | |
| hoveredIndex = ''; | |
| } | |
| // 使用更新后的 option,渲染图表 | |
| myChart.setOption(that.option); | |
| }); | |
| } | |
| } |
第四:我想说一下注意事项哈
1、因为这些代码比较复杂(我看不懂 只是尽量把配置样式相关给了一下注解 希望有帮助)
2、一开始只想实现效果的(不要先封装成组件 很可能会失败 先在要实现的页面写)
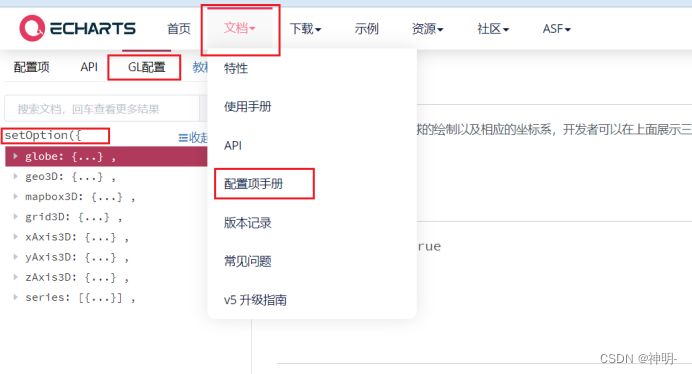
3、gl 3d相关的配置可以在官方文档上查看理解 (下面附赠链接)
https://echarts.apache.org/zh/option-gl.html#globe
4、在提供给你们一个echarts图集表(挺全的很多案例参考)https://www.isqqw.com/