ProPlot绘图库(Python)
最近师兄推荐了一个Python的绘图库,感觉用这个库画的图都挺好看的。相对于原生的matplotlib,ProPlot画出来的库更适合用在论文里面。 同时,这个绘图库还可以绘制地理空间图,类似于Cartopy、Basemap。这个库就非常适合遥感人。下面我们就一起看看它的绘图效果吧!
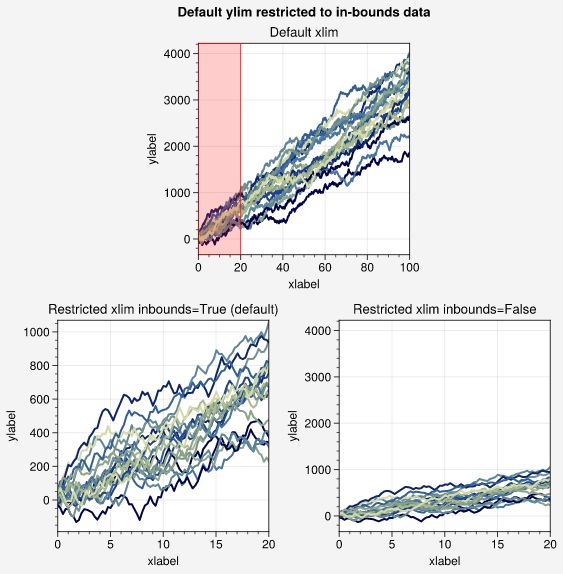
折线图绘制
import proplot as pplt
import numpy as np
cycle = pplt.Cycle('davos', right=0.8)
state = np.random.RandomState(51423)
N, M = 400, 20
xmax = 20
x = np.linspace(0, 100, N)
y = 100 * (state.rand(N, M) - 0.42).cumsum(axis=0)
fig = pplt.figure(refwidth=2.2, share=False)
axs = fig.subplots([[0, 1, 1, 0], [2, 2, 3, 3]], wratios=(2, 1, 1, 2))
axs[0].axvspan(
0, xmax, zorder=3, edgecolor='red', facecolor=pplt.set_alpha('red', 0.2),
)
for i, ax in enumerate(axs):
inbounds = i == 1
title = f'Restricted xlim inbounds={inbounds}'
title += ' (default)' if inbounds else ''
ax.format(
xmax=(None if i == 0 else xmax),
title=('Default xlim' if i == 0 else title),
)
ax.plot(x, y, cycle=cycle, inbounds=inbounds)
fig.format(
xlabel='xlabel',
ylabel='ylabel',
suptitle='Default ylim restricted to in-bounds data'
)
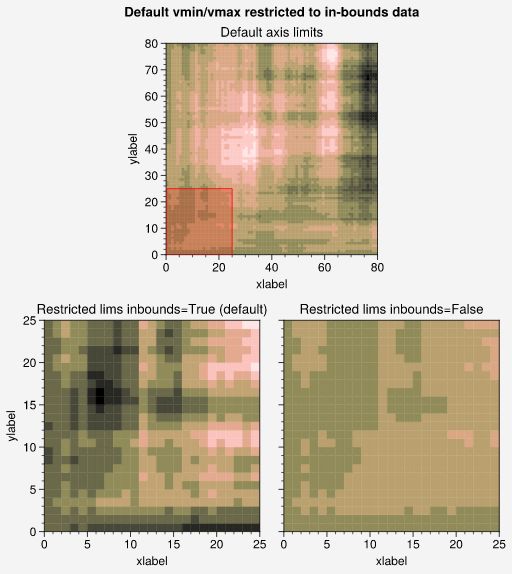
二维热力图绘制图
import proplot as pplt
import numpy as np
cmap = 'turku_r'
state = np.random.RandomState(51423)
N = 80
x = y = np.arange(N + 1)
data = 10 + (state.normal(0, 3, size=(N, N))).cumsum(axis=0).cumsum(axis=1)
xlim = ylim = (0, 25)
fig, axs = pplt.subplots(
[[0, 1, 1, 0], [2, 2, 3, 3]], wratios=(1.3, 1, 1, 1.3), span=False, refwidth=2.2,
)
axs[0].fill_between(
xlim, *ylim, zorder=3, edgecolor='red', facecolor=pplt.set_alpha('red', 0.2),
)
for i, ax in enumerate(axs):
inbounds = i == 1
title = f'Restricted lims inbounds={inbounds}'
title += ' (default)' if inbounds else ''
ax.format(
xlim=(None if i == 0 else xlim),
ylim=(None if i == 0 else ylim),
title=('Default axis limits' if i == 0 else title),
)
ax.pcolor(x, y, data, cmap=cmap, inbounds=inbounds)
fig.format(
xlabel='xlabel',
ylabel='ylabel',
suptitle='Default vmin/vmax restricted to in-bounds data'
)
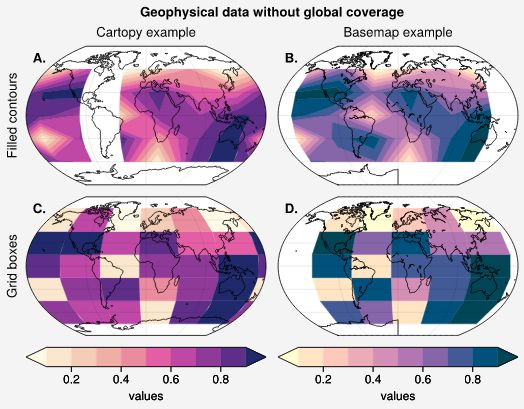
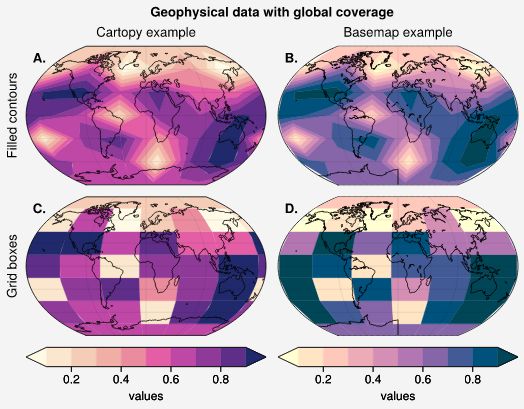
绘制空间图
这里需要注意的是,这个库绘制空间图是以Cartopy或者Basemap库为基础的。
import proplot as pplt
import numpy as np
offset = -40
lon = pplt.arange(offset, 360 + offset - 1, 60)
lat = pplt.arange(-60, 60 + 1, 30)
state = np.random.RandomState(51423)
data = state.rand(len(lat), len(lon))
for globe in (False, True):
string = 'with' if globe else 'without'
gs = pplt.GridSpec(nrows=2, ncols=2)
fig = pplt.figure(refwidth=2.5)
for i, ss in enumerate(gs):
ax = fig.subplot(ss, proj='kav7', basemap=(i % 2))
cmap = ('sunset', 'sunrise')[i % 2]
if i > 1:
ax.pcolor(lon, lat, data, cmap=cmap, globe=globe, extend='both')
else:
m = ax.contourf(lon, lat, data, cmap=cmap, globe=globe, extend='both')
fig.colorbar(m, loc='b', span=i + 1, label='values', extendsize='1.7em')
fig.format(
suptitle=f'Geophysical data {string} global coverage',
toplabels=('Cartopy example', 'Basemap example'),
leftlabels=('Filled contours', 'Grid boxes'),
toplabelweight='normal', leftlabelweight='normal',
coast=True, lonlines=90,
abc='A.', abcloc='ul', abcborder=False,
)
整体上看,这个绘图库画出来的还是不错的,比较适合习惯用Python的同学使用。