K-nearest neighbor(KNN)是机器学习中最受欢迎的算法之一,被广泛应用于监督学习和无监督学习。在监督学习中,KNN用于计算与k个邻居的距离,并可以定义离群值。而在无监督学习中,KNN也可以用于计算邻居的距离,然后定义离群值。在PyOD中,KNN算法主要用于无监督学习。本文将讨论KNN在监督学习和无监督学习中的应用以及如何定义异常点得分。更多异常检测技术可见文末好文推荐~
KNN 作为无监督学习
无监督 KNN 方法使用欧氏距离计算观测值和其他观测值之间的距离,无需调整参数即可提高性能。其步骤包括计算每个数据点与其他数据点的距离,根据距离从小到大对数据点进行排序,然后选取前 K 个条目。常用的距离计算方法之一是欧氏距离。
- 步骤1:计算每个数据点与其他数据点的距离。
- 步骤2:根据距离从小到大对数据点进行排序。
- 步骤3:选取前 K 个条目。
计算两个数据点之间的距离有多种选择。最常用的是欧氏距离。
KNN 作为监督学习
KNN算法是一种常用的监督学习分类算法,用于预测新数据点的类别,基于假设相似的数据点通常彼此靠近。通过计算新数据点与其他数据点的距离并选取最近的 5 个邻居,算法进行了类别统计,然后采用多数投票规则来确定类别。举例来说,当出现一个新数据点时,如果有 4 个红色类和 1 个蓝色类的邻居,那么该新数据点将被分配为红色类。
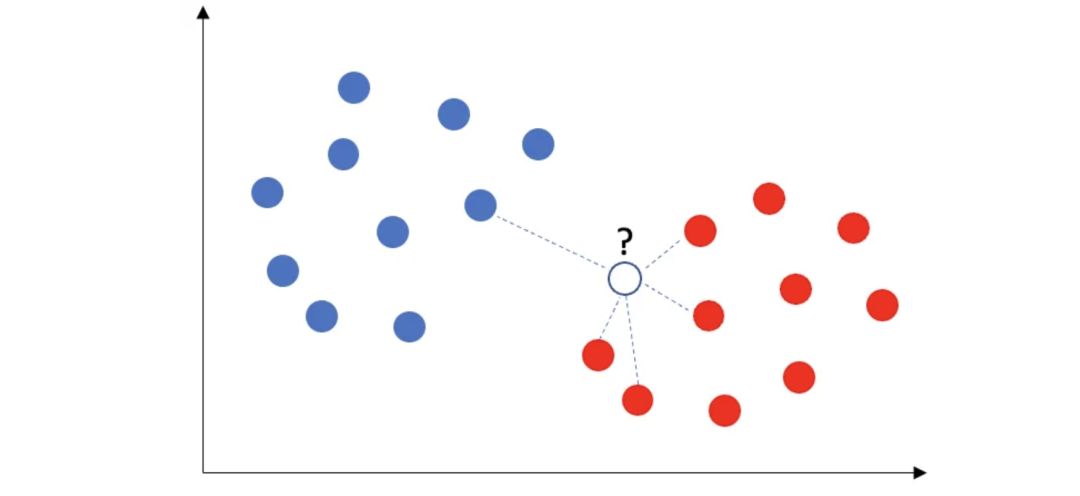
KNN 监督学习算法
这个过程可以总结如下:除了步骤1至3外,监督学习KNN还包括步骤4和5:
- 步骤4:在这K个邻居中,统计类别的数量。
- 步骤5:将新数据点分配到多数类。
如何定义异常点得分?
离群点是与相邻点距离较远的点,其离群点得分定义为与其第 k 个近邻的距离。每个点都有一个离群点得分。我们的目标是找出离群点得分高的点。
PyOD 中的 KNN 方法使用三种距离度量之一作为离群点得分:最大值(默认值)、平均值和中值。最大值使用到 k 个邻居的最大距离作为离群点得分,而平均值和中值分别使用平均值和中值作为离群值。
建模步骤
在建模过程中,步骤1要建立模型并识别离群值。步骤2选择一个阈值,将离群值和正常观测值分开。在步骤3中,使用各组的描述性统计量对两组进行分析,确保模型合理性。若发现异常组特征的平均值与预期不符,需调查、修改或放弃该特征,并重复以上步骤直到符合预期。
步骤 1:建立模型
使用PyOD的generate_data()实用程序生成带有异常值的数据,其中包含10%的离群值。需要注意的是,尽管这个模拟数据集包含目标变量Y,但无监督的KNN模型只使用X变量,而Y变量仅用于验证。
| import numpy as np | |
| import pandas as pd | |
| import matplotlib.pyplot as plt | |
| from pyod.utils.data import generate_data | |
| contamination = 0.05 # percentage of outliers | |
| n_train = 500 # number of training points | |
| n_test = 500 # number of testing points | |
| n_features = 6 # number of features | |
| X_train, X_test, y_train, y_test = generate_data( | |
| n_train=n_train, | |
| n_test=n_test, | |
| n_features= n_features, | |
| contamination=contamination, | |
| random_state=123) | |
| # Make the 2d numpy array a pandas dataframe for each manipulation | |
| X_train_pd = pd.DataFrame(X_train) | |
| # Plot | |
| plt.scatter(X_train_pd[0], X_train_pd[1], c=y_train, alpha=0.8) | |
| plt.title('Scatter plot') | |
| plt.xlabel('x0') | |
| plt.ylabel('x1') | |
| plt.show() |
散点图中的黄色点是百分之十的异常值。紫色点为 "正常" 观测值。
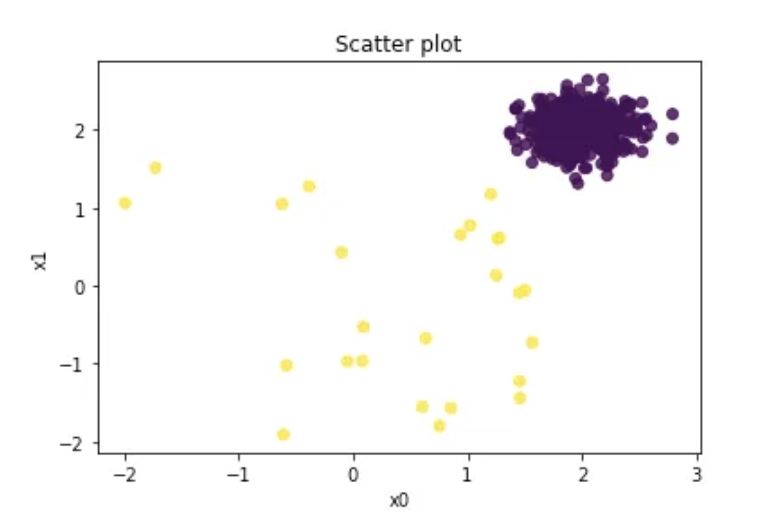
以下代码计算 k-NN 模型,并将其存储为 knn,请注意,函数.fit() 中没有 y,在无监督方法中,y 会被忽略。def fit(self, X,y=None) 如果指定了 y,就会变成监督方法。
接下来的代码将建立模型,并对训练数据和测试数据进行评分。每行的含义如下:
label_:训练数据的标签向量,在训练数据上使用.predict()时也是如此。decision_scores_:训练数据的分数向量,在训练数据上使用.decision_functions()时也是如此。Decisoin_score():为每个观测值分配离群值分数的评分函数。predict():预测函数,根据指定的阈值赋值 1 或 0。contamination:异常值的百分比,PyOD 将污染率默认为 10%。该参数不影响离群值分数的计算。
| from pyod.models.knn import KNN | |
| knn = KNN(contamination=0.05) | |
| knn.fit(X_train) | |
| # Training data | |
| y_train_scores = knn.decision_function(X_train) | |
| y_train_pred = knn.predict(X_train) | |
| # Test data | |
| y_test_scores = knn.decision_function(X_test) | |
| y_test_pred = knn.predict(X_test) # outlier labels (0 or 1) | |
| def count_stat(vector): | |
| # Because it is '0' and '1', we can run a count statistic. | |
| unique, counts = np.unique(vector, return_counts=True) | |
| return dict(zip(unique, counts)) | |
| print("The training data:", count_stat(y_train_pred)) | |
| print("The training data:", count_stat(y_test_pred)) | |
| # Threshold for the defined comtanimation rate | |
| print("The threshold for the defined comtanimation rate:" , knn.threshold_) | |
| The training data: {0: 475, 1: 25} | |
| The training data: {0: 475, 1: 25} | |
| The threshold for the defined comtanimation rate: | |
| 0.7566127656515499 |
让我们使用.get_params() 查看 KNN 的默认参数。邻居数为 5.0。污染率设置为 5%。
| knn.get_params() | |
| {'algorithm': 'auto', | |
| 'contamination': 0.05, | |
| 'leaf_size': 30, | |
| 'method': 'largest', | |
| 'metric': 'minkowski', | |
| 'metric_params': None, | |
| 'n_jobs': 1, | |
| 'n_neighbors': 5, | |
| 'p': 2, | |
| 'radius': 1.0} |
步骤 2:确定合理的阈值
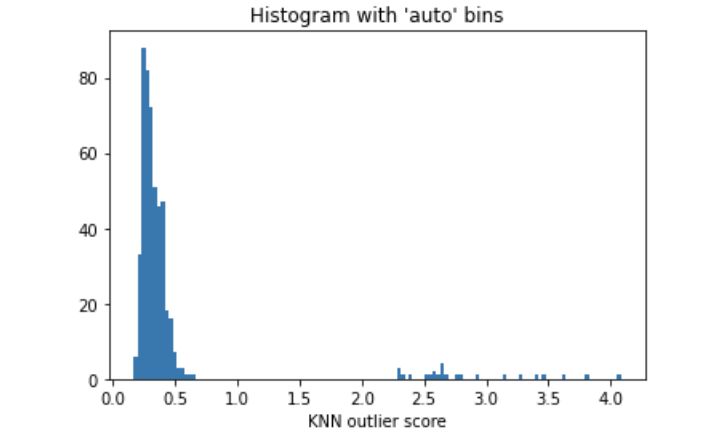
在大多数情况下,我们无法确定异常值的百分比。我们可以利用异常值得分的直方图来选择合理的阈值。如果有先验知识表明异常值占1%,那么应选择一个使得异常值约为1%的阈值。图(D.2)中的离群点得分直方图显示阈值为200.0,因为直方图中存在一个自然的切点。大多数数据点的异常点得分都很低。若选择1.0作为切点,可以认为那些>=1.0的数据点是异常值。
| import matplotlib.pyplot as plt | |
| plt.hist(y_train_scores, bins='auto') # arguments are passed to np.histogram | |
| plt.title("Histogram with 'auto' bins") | |
| plt.xlabel('KNN outlier score') | |
| plt.show() |
步骤 3:分析正常组和异常组
对于证明模型合理性来说,剖析正常组和异常组是关键步骤。正常组和异常组的特征统计数据应与领域知识保持一致。如果异常组中某个特征的平均值与预期相反,建议检查、修改或放弃该特征。需要重复建模过程,直到所有特征都与先验知识保持一致。同时,如果数据提供了新的见解,也建议验证先前的知识。
| threshold = knn.threshold_ # Or other value from the above histogram | |
| def descriptive_stat_threshold(df,pred_score, threshold): | |
| # Let's see how many '0's and '1's. | |
| df = pd.DataFrame(df) | |
| df['Anomaly_Score'] = pred_score | |
| df['Group'] = np.where(df['Anomaly_Score']< threshold, 'Normal', 'Outlier') | |
| # Now let's show the summary statistics: | |
| cnt = df.groupby('Group')['Anomaly_Score'].count().reset_index().rename(columns={'Anomaly_Score':'Count'}) | |
| cnt['Count %'] = (cnt['Count'] / cnt['Count'].sum()) * 100 # The count and count % | |
| stat = df.groupby('Group').mean().round(2).reset_index() # The avg. | |
| stat = cnt.merge(stat, left_on='Group',right_on='Group') # Put the count and the avg. together | |
| return (stat) | |
| descriptive_stat_threshold(X_train,y_train_scores, threshold) |

统计分析
正常组和异常组的特征显示在上表中,包括计数和计数百分比。该表揭示了几个关键结果:
- 离群组的大小:一旦确定了阈值,大小也就确定了。大小统计成了一个很好的参考,尤其是当阈值来源于图 (D.2) 而且没有任何先验知识时。
- 每组中的特征统计量:所有均值必须与领域知识一致。在我们的案例中,离群组的均值小于正常组的均值。
- 异常点平均得分:离群组的平均得分应高于正常组。对分数不需要做太多解释。
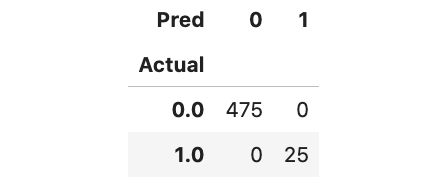
因为我们已经掌握了基本事实,所以可以生成混淆矩阵来了解模型的性能。该模型表现出色,成功识别出了所有 25 个离群值。
| Actual_pred = pd.DataFrame({'Actual': y_test, 'Anomaly_Score': y_test_scores}) | |
| Actual_pred['Pred'] = np.where(Actual_pred['Anomaly_Score']< threshold,0,1) | |
| pd.crosstab(Actual_pred['Actual'],Actual_pred['Pred']) |
通过汇总多个模型实现模型稳定性
要生成结果稳定的模型,最好的做法是建立多个 KNN 模型,然后汇总得分。这种方法可以减少过拟合的机会,提高预测的准确性。
PyOD 模块提供了四种汇总结果的方法。只需使用一种方法即可得出汇总结果。
- 平均(AVG)
- 最大值的最大值 (MOM)
- 平均最大值 (AOM)
- 平均值的最大值 (MOA)
我将创建 20 个 KNN 模型,k 个邻居的范围从 10 到 200。
| from pyod.models.combination import aom, moa, average, maximization | |
| from pyod.utils.utility import standardizer | |
| # Standardize data | |
| X_train_norm, X_test_norm = standardizer(X_train, X_test) | |
| # Test a range of k-neighbors from 10 to 200. There will be 20 k-NN models. | |
| k_list = [10, 20, 30, 40, 50, 60, 70, 80, 90, 100, 110, | |
| 120, 130, 140, 150, 160, 170, 180, 190, 200] | |
| n_clf = len(k_list) | |
| # Just prepare data frames so we can store the model results | |
| train_scores = np.zeros([X_train.shape[0], n_clf]) | |
| test_scores = np.zeros([X_test.shape[0], n_clf]) | |
| train_scores.shape | |
| # Modeling | |
| for i in range(n_clf): | |
| k = k_list[i] | |
| clf = KNN(n_neighbors=k, method='largest') | |
| clf.fit(X_train_norm) | |
| # Store the results in each column: | |
| train_scores[:, i] = clf.decision_scores_ | |
| test_scores[:, i] = clf.decision_function(X_test_norm) | |
| # Decision scores have to be normalized before combination | |
| train_scores_norm, test_scores_norm = standardizer(train_scores,test_scores) | |
| # Combination by average | |
| # The test_scores_norm is 500 x 10. The "average" function will take the average of the 10 columns. | |
| # The result "y_by_average" is a single column: | |
| y_train_by_average = average(train_scores_norm) | |
| y_test_by_average = average(test_scores_norm) | |
| import matplotlib.pyplot as plt | |
| plt.hist(y_train_by_average, bins='auto') # arguments are passed to np.histogram | |
| plt.title("Combination by average") | |
| plt.show() |
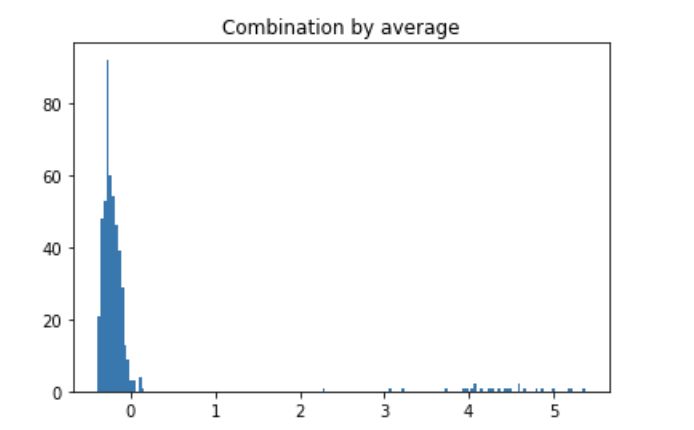
训练数据平均预测值直方图
大部分数据低于 0.0,部分异常值在 1.0 左右。将阈值设置为 1.0 或甚至 2.0 可能更合理。这样,可以对正常组和离群组进行分析。25 个数据点被确定为离群值。离群组的特征均值均小于正常组,与下表的结果一致。
descriptive_stat_threshold(X_train,y_train_by_average, 0.5)

KNN算法总结
无监督 KNN 方法使用欧氏距离计算观测值之间的关系,无需调整参数即可计算邻居之间的距离。KNN 将离群值定义为与第 k 个近邻的距离。