目录
- 在echarts 中实现渐变的具体几种方式
- 方式一:
- 方式二:colorStops
- 总结
在echarts 中实现渐变的具体几种方式
在我们日常使用Echarts图表过程中,会遇到一些要求我们的echarts图表能实现颜色渐变,以下几种方式就能满足你的需求。文档参考 ECharts option 文档 。
方式一:
线性渐变:new echarts.graphic.LinearGradient(x,y,x2,y2,offset,boolean)
- x,y,x2,y2,包围框中的百分比,数值范围 0-1;
- offset,类似颜色线性梯度,数值范围 0-1;
- boolean,默认false,若最后参数为true,前四个参数将使用像素位置。
径向渐变:new echarts.graphic.RadialGradient(x,y,r,offset,boolean)
- x,y,代表圆心,数值范围 0-1;
- r,代表半径,数值范围 0-1;
- offset,类似颜色线性梯度,数值范围 0-1;
- boolean,默认false,若最后参数为true,前四个参数将使用像素位置。
采用图片显示:new echarts.graphic.Pattern(imageDom,repeat)
- imageDom,仅支持 HTMLImageElement 和 HTMLCanvasElement形式图片;
- repeat,默认’repeat’,可取值还有’repeat-x’, ‘repeat-y’, or ‘no-repeat’;
代码示例:
| // 创建 HTMLImageElement | |
| // HTMLCanvasElement请自行研究去 | |
| var imageDom = new Image(); // Image 构造函数 | |
| imageDom.src = '/static/img/map_bg.png'; // 图片路径 | |
| imageDom.alt = '这是一张图片'; | |
| // 应用如下 | |
| // color:{ | |
| // image: imageDom, // 支持为 HTMLImageElement, HTMLCanvasElement,不支持路径字符串 | |
| // repeat: 'repeat' // 是否平铺,可以是 'repeat-x', 'repeat-y', 'no-repeat' | |
| // } |
方式二:colorStops
线性渐变:colorStops - linear
- type:‘linear’,线性渐变
- x,y,x2,y2,代表包围框中的百分比,数值范围 0-1;
- colorStops,类似颜色线性梯度,数值范围 0-1;
- global,默认false
径向渐变:colorStops - radial
- type:‘radial’,径向渐变
- x,y,代表圆心,数值范围 0-1;
- r,代表半径,数值范围 0-1;
- colorStops,类似颜色线性梯度,数值范围 0-1;
- global,默认false
效果图:
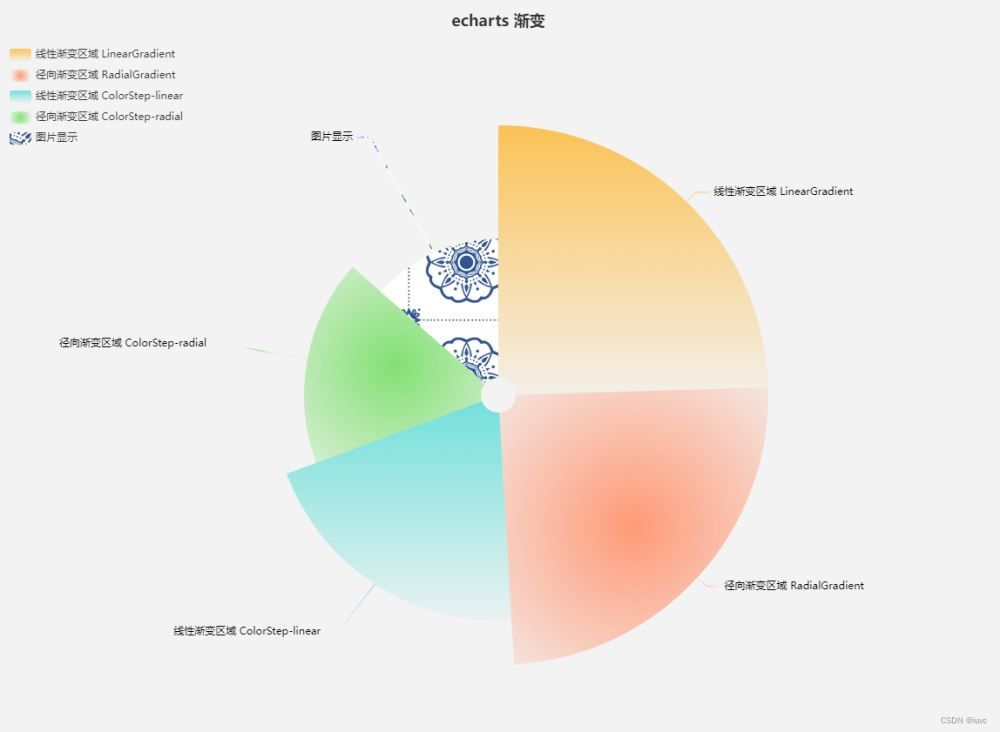
代码如下:
| var imageDom = new Image(); // Image 构造函数 | |
| imageDom.src = 'https://github.com/iuvc/magicJs/blob/main/public/images/issues/blue-white-background.jpg?raw=true'; | |
| imageDom.alt = '测试'; | |
| option = { | |
| title: { | |
| text: 'echarts 渐变', | |
| left: 'center' | |
| }, | |
| tooltip: { | |
| trigger: 'item', | |
| formatter: '{a} <br/>{b} : {c} ({d}%)' | |
| }, | |
| legend: { | |
| top:, | |
| left:, | |
| orient: 'vertical', | |
| data: [ | |
| '线性渐变区域 LinearGradient', | |
| '径向渐变区域 RadialGradient', | |
| '线性渐变区域 ColorStep-linear', | |
| '径向渐变区域 ColorStep-radial', | |
| '图片显示' | |
| ] | |
| }, | |
| series: [ | |
| { | |
| name: 'Radius Mode', | |
| type: 'pie', | |
| radius: [, '70%'], | |
| center: ['%', '50%'], | |
| roseType: 'radius', | |
| itemStyle: { | |
| borderRadius: | |
| }, | |
| label: { | |
| show: true | |
| }, | |
| emphasis: { | |
| label: { | |
| show: true | |
| } | |
| }, | |
| data: [ | |
| { | |
| value:, | |
| name: '线性渐变区域 LinearGradient', | |
| itemStyle: { | |
| // 线性渐变方式一 ====================================================== | |
| // LinearGradient前四个分参数别代表右,下,左,上,数值-1 | |
| color: new echarts.graphic.LinearGradient(, 0, 0, 1, [ | |
| { | |
| offset:, | |
| color: 'rgba(,174,19,0.7)' | |
| }, | |
| { | |
| offset:, | |
| color: 'rgba(,174,19,0.05)' | |
| } | |
| ]) | |
| } | |
| }, | |
| { | |
| value:, | |
| name: '径向渐变区域 RadialGradient', | |
| itemStyle: { | |
| // 径向渐变方式一 ====================================================== | |
| // RadialGradient前三个分参数别代表圆心(x,y),半径(数值-1) | |
| color: new echarts.graphic.RadialGradient(.5, 0.5, 0.8, [ | |
| { | |
| offset:, | |
| color: 'rgba(,154,119,1)' | |
| }, | |
| { | |
| offset:, | |
| color: 'rgba(,154,119,0.05)' | |
| } | |
| ]) | |
| } | |
| }, | |
| { | |
| value:, | |
| name: '线性渐变区域 ColorStep-linear', | |
| itemStyle: { | |
| // 线性渐变方式二 ====================================================== | |
| // x,y,x,y2数值同LinearGradient前四个参数分别代表右,下,左,上,数值0-1 | |
| color: { | |
| type: 'linear', | |
| x:, | |
| y:, | |
| x: 0, | |
| y: 1, | |
| colorStops: [ | |
| { | |
| offset:, | |
| color: 'rgba(,216,208,0.7)' // 0% 处的颜色 | |
| }, | |
| { | |
| offset:, | |
| color: 'rgba(,216,208,0.05)' // 100% 处的颜色 | |
| } | |
| ], | |
| global: false // 缺省为 false | |
| } | |
| } | |
| }, | |
| { | |
| value:, | |
| name: '径向渐变区域 ColorStep-radial', | |
| itemStyle: { | |
| // 径向渐变方式二 ====================================================== | |
| // x.5 y 0.5 代表圆心,r 代表半径 | |
| color: { | |
| type: 'radial', | |
| x:.5, | |
| y:.5, | |
| r:.9, | |
| colorStops: [ | |
| { | |
| offset:, | |
| color: 'rgba(,216,60, 0.7)' // 0% 处的颜色 | |
| }, | |
| { | |
| offset:, | |
| color: 'rgba(,216,60, 0.05)' // 100% 处的颜色 | |
| } | |
| ], | |
| global: false // 缺省为 false | |
| } | |
| } | |
| }, | |
| { | |
| value:, | |
| name: '图片显示' , | |
| itemStyle: { | |
| // 图片显示 ====================================================== | |
| color: { | |
| image: imageDom, // 支持为 HTMLImageElement, HTMLCanvasElement,不支持路径字符串 | |
| repeat: 'repeat' // 是否平铺,可以是 'repeat-x', 'repeat-y', 'no-repeat' | |
| } | |
| } | |
| } | |
| ] | |
| } | |
| ] | |
| }; |
其他示例:
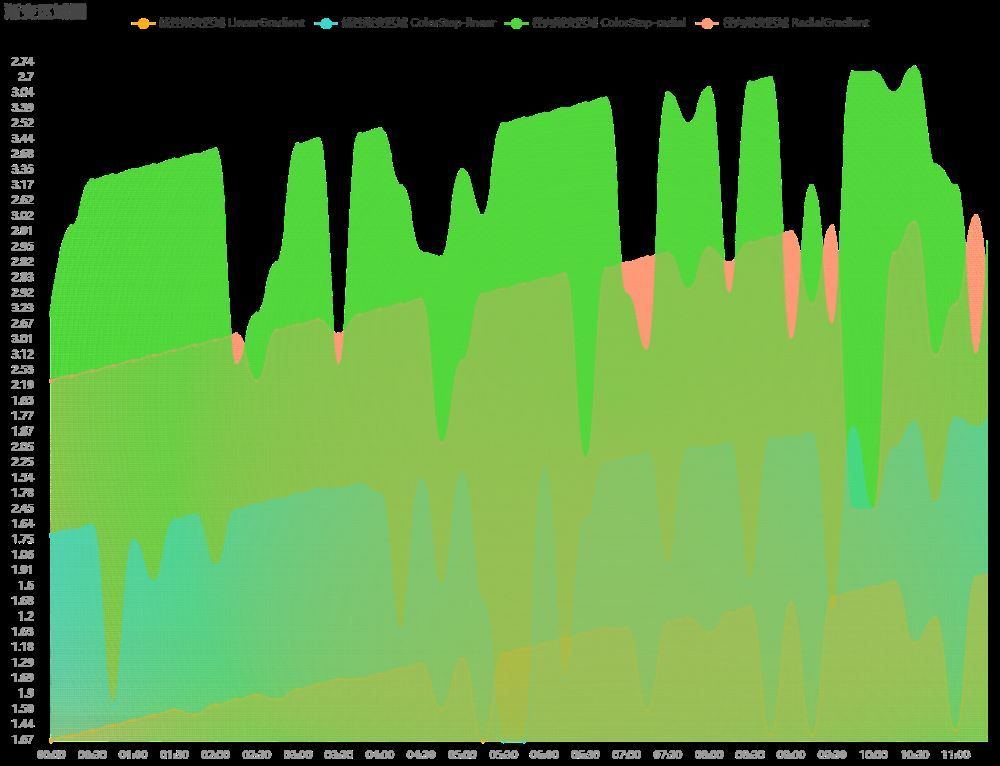
代码如下:
| option = { | |
| title: { | |
| text: '渐变区域图' | |
| }, | |
| tooltip: { | |
| trigger: 'axis', | |
| axisPointer: { | |
| type: 'cross', | |
| label: { | |
| backgroundColor: '#a7985' | |
| } | |
| } | |
| }, | |
| legend: { | |
| top:, | |
| data: [ | |
| '线性渐变区域 LinearGradient', | |
| '线性渐变区域 ColorStep-linear', | |
| '径向渐变区域 ColorStep-radial', | |
| '径向渐变区域 RadialGradient' | |
| ] | |
| }, | |
| grid: { | |
| top:, | |
| left:, | |
| right:, | |
| bottom: | |
| }, | |
| xAxis: [ | |
| { | |
| type: 'category', | |
| boundaryGap: true, | |
| axisLine: { | |
| show: false, | |
| onZero: true, | |
| lineStyle: { | |
| color: '#' | |
| } | |
| }, | |
| splitLine: { | |
| show: false | |
| }, | |
| axisTick: { | |
| show: false | |
| }, | |
| data: [ | |
| ':00', | |
| ':15', | |
| ':30', | |
| ':45', | |
| ':00', | |
| ':15', | |
| ':30', | |
| ':45', | |
| ':00', | |
| ':15', | |
| ':30', | |
| ':45', | |
| ':00', | |
| ':15', | |
| ':30', | |
| ':45', | |
| ':00', | |
| ':15', | |
| ':30', | |
| ':45', | |
| ':00', | |
| ':15', | |
| ':30', | |
| ':45', | |
| ':00', | |
| ':15', | |
| ':30', | |
| ':45', | |
| ':00', | |
| ':15', | |
| ':30', | |
| ':45', | |
| ':00', | |
| ':15', | |
| ':30', | |
| ':45', | |
| ':00', | |
| ':15', | |
| ':30', | |
| ':45', | |
| ':00', | |
| ':15', | |
| ':30', | |
| ':45', | |
| ':00', | |
| ':15' | |
| ] | |
| } | |
| ], | |
| yAxis: [ | |
| { | |
| type: 'category', | |
| boundaryGap: true, | |
| axisLine: { | |
| show: false, | |
| onZero: true, | |
| lineStyle: { | |
| color: '#' | |
| } | |
| }, | |
| splitLine: { | |
| show: false | |
| }, | |
| axisTick: { | |
| show: false | |
| } | |
| } | |
| ], | |
| series: [ | |
| { | |
| name: '线性渐变区域 LinearGradient', | |
| type: 'line', | |
| stack: '总量', | |
| data: [.67, 1.25, 1.02, 1.44, 1.81, 1.13, 1.58, 1.13, 1.56, 1.3, 1.9, 1.3, | |
| .55, 1.94, 1.69, 1.69, 1.8, 1.21, 1.29, 1.58, 1.04, 1.67, 1.07, 1.18, | |
| .57, 1.05, 1.63, 1.28, 1.28, 1.58, 1.88, 1.2, 1.63, 1.59, 1.43, 1.25, | |
| .68, 1.25, 1.12, 1.31, 1.6, 1.62, 1.57, 1.2, 1.02, 1.42, 1.91, 1.97, | |
| .32, 1.06, 1.3, 1.22, 1.74, 1.02, 1.75, 1.2 | |
| ], | |
| areaStyle: { | |
| color: new echarts.graphic.LinearGradient(, 0, 0, 1, [ | |
| { | |
| offset:, | |
| color: 'rgba(,174,19,0.7)' | |
| }, | |
| { | |
| offset:, | |
| color: 'rgba(,174,19,0.05)' | |
| } | |
| ]) | |
| }, | |
| itemStyle: { | |
| color: 'rgba(,174,19,.1)' | |
| }, | |
| lineStyle: { | |
| color: 'rgba(,174,19,.1)' | |
| }, | |
| smooth: true, | |
| smoothMonotone: 'x', | |
| symbol: 'circle' | |
| }, | |
| { | |
| name: '线性渐变区域 ColorStep-linear', | |
| type: 'line', | |
| stack: '总量', | |
| data: [.31, 2.27, 1.64, 1.56, 1.75, 1.62, 2.18, 2.12, 1.97, 2.45, 2.39, 2.3, | |
| .78, 1.82, 1.82, 1.76, 1.78, 1.63, 1.54, 1.6, 1.61, 1.68, 1.67, 1.67, | |
| .34, 1.69, 2.18, 2.25, 2.44, 2.4, 1.97, 2.05, 2.05, 2.46, 1.62, 1.66, | |
| .66, 1.87, 1.59, 1.99, 2.45, 2.05, 1.53, 2.39, 1.77, 1.99, 2.14, 2.33, | |
| .55, 1.87, 1.65, 2.02, 1.68, 2.13, 1.88, 2.19 | |
| ], | |
| areaStyle: { | |
| color: { | |
| type: 'linear', | |
| x:, | |
| y:, | |
| x: 0, | |
| y: 1, | |
| colorStops: [ | |
| { | |
| offset:, | |
| color: 'rgba(,216,208,0.7)' // 0% 处的颜色 | |
| }, | |
| { | |
| offset:, | |
| color: 'rgba(,216,208,0.05)' // 100% 处的颜色 | |
| } | |
| ], | |
| global: false // 缺省为 false | |
| } | |
| }, | |
| itemStyle: { | |
| color: 'rgba(,216,208,.1)' | |
| }, | |
| lineStyle: { | |
| color: 'rgba(,216,208,.1)' | |
| }, | |
| smooth: true, | |
| smoothMonotone: 'x', | |
| symbol: 'circle' | |
| }, | |
| { | |
| name: '径向渐变区域 RadialGradient', | |
| type: 'line', | |
| stack: '总量', | |
| label: { | |
| normal: { | |
| show: true, | |
| position: 'top' | |
| } | |
| }, | |
| data: [.69, 2.47, 2.53, 3.31, 3.25, 3.12, 2.66, 2.58, 3.01, 3.21, 2.69, 2.72, | |
| .67, 3.34, 3.21, 2.79, 3.23, 3.07, 2.84, 2.46, 3.25, 2.92, 2.42, 2.61, | |
| .83, 3.29, 2.44, 3.38, 2.82, 2.56, 2.94, 2.42, 2.95, 2.82, 3.18, 2.6, | |
| .91, 3.07, 2.57, 2.45, 2.45, 2.94, 2.86, 3.12, 3.07, 3.02, 2.53, 2.64, | |
| .97, 2.62, 2.79, 2.68, 3.24, 3.38, 2.67, 3.17 | |
| ], | |
| areaStyle: { | |
| color: new echarts.graphic.RadialGradient(.5, 0.5, 0.8, [ | |
| { | |
| offset:, | |
| color: 'rgba(,154,119,.7)' | |
| }, | |
| { | |
| offset:, | |
| color: 'rgba(,154,119,0.05)' | |
| } | |
| ]) | |
| }, | |
| itemStyle: { | |
| color: 'rgba(,154,119,.1)' | |
| }, | |
| lineStyle: { | |
| color: 'rgba(,154,119,.1)' | |
| }, | |
| smooth: true, | |
| smoothMonotone: 'x', | |
| symbol: 'circle' | |
| }, | |
| { | |
| name: '径向渐变区域 ColorStep-radial', | |
| type: 'line', | |
| stack: '总量', | |
| label: { | |
| normal: { | |
| show: true, | |
| position: 'top' | |
| } | |
| }, | |
| data: [.79, 2.57, 2.63, 3.41, 3.35, 3.22, 2.76, 2.68, 3.11, 3.31, 2.79, 2.82, | |
| .77, 3.44, 3.31, 2.89, 3.33, 3.17, 2.94, 2.56, 3.35, 3.02, 2.52, 2.71, | |
| .93, 3.39, 2.54, 3.48, 2.92, 2.66, 3.04, 2.52, 3.05, 2.92, 3.28, 2.7, | |
| .01, 3.17, 2.67, 2.55, 2.55, 3.04, 2.96, 3.22, 3.17, 3.12, 2.63, 2.74, | |
| .07, 2.72, 2.89, 2.78, 3.34, 3.48, 2.77, 3.27 | |
| ], | |
| areaStyle: { | |
| color: { | |
| type: 'radial', | |
| x:.5, | |
| y:.5, | |
| r:.9, | |
| colorStops: [ | |
| { | |
| offset:, | |
| color: 'rgba(,216,60, 0.7)' // 0% 处的颜色 | |
| }, | |
| { | |
| offset:, | |
| color: 'rgba(,216,60, 0.05)' // 100% 处的颜色 | |
| } | |
| ], | |
| global: false // 缺省为 false | |
| } | |
| }, | |
| itemStyle: { | |
| color: 'rgba(,216,60,.1)' | |
| }, | |
| lineStyle: { | |
| color: 'rgba(,216,60,.1)' | |
| }, | |
| smooth: true, | |
| smoothMonotone: 'x', | |
| symbol: 'circle' | |
| } | |
| ] | |
| }; |