目录
- chartPan.vue
- 使用 chartPan.vue 之饼图
- 使用 chartPan.vue 之折线图
- 展开大图
- 大图组件 maxChart.vue
折线图,饼图
chartPan.vue
| <template> | |
| <div> | |
| <div | |
| class="chart-header" | |
| :style="{'margin-bottom': chartType == 'line' ? '20px' : 0}" | |
| > | |
| <span class="chart-title">{{ title }}</span> | |
| <slot name="right" /> | |
| </div> | |
| <div | |
| v-if="!isNoData" | |
| > | |
| <div | |
| ref="pie" | |
| class="echarts" | |
| :style="{'height': chartHeight}" | |
| /> | |
| </div> | |
| <div | |
| v-else | |
| class="no-data" | |
| > | |
| <empty :imagew="160" /> | |
| </div> | |
| </div> | |
| </template> | |
| <script> | |
| import echarts from 'echarts'; | |
| export default { | |
| props: { | |
| chartType: { | |
| type: String, | |
| default: 'pie' | |
| }, | |
| chartHeight: { | |
| type: String, | |
| default: '220px' | |
| }, | |
| title: { | |
| type: String, | |
| default: '' | |
| } | |
| }, | |
| data() { | |
| return { | |
| isNoData: false | |
| }; | |
| }, | |
| methods: { | |
| pieInit(data, text, subtext, tab = 'node') { | |
| data = data.filter(i=>+i.value != 0); | |
| if (data.length < 1) { | |
| this.isNoData = true; | |
| } else { | |
| this.isNoData = false; | |
| } | |
| if (this.isNoData) return; | |
| this.$nextTick(()=>{ | |
| let myChart = echarts.init(this.$refs['pie']); | |
| myChart.clear(); | |
| myChart.setOption({ | |
| tooltip: { | |
| trigger: 'item' | |
| }, | |
| legend: { | |
| orient: 'vertical', | |
| right: '10%', | |
| top: tab === 'node' || data.length < 5 ? '22%' : null, | |
| itemGap: tab === 'node' ? 17 : 10, | |
| itemWidth: 8, | |
| icon: 'circle', | |
| textStyle: { | |
| color: '#666', | |
| lineHeight: 25 | |
| }, | |
| formatter: (name) => { | |
| let tarValue; | |
| for (let i = 0; i < data.length; i++) { | |
| if (data[i].name == name) { | |
| tarValue = data[i].value; | |
| } | |
| } | |
| return `${name}: ${tarValue}`; | |
| } | |
| }, | |
| title: { | |
| show: !!subtext, | |
| text: text, | |
| textAlign: 'middle', | |
| subtext: `${subtext}`, | |
| left: '26%', | |
| top: '25%', | |
| itemGap: 15, | |
| textStyle: { | |
| fontSize: 14, | |
| color: '#666', | |
| fontWeight: 400 | |
| }, | |
| subtextStyle: { | |
| fontSize: 24, | |
| color: '#333', | |
| fontWeight: 600 | |
| } | |
| }, | |
| textStyle: { | |
| rich: { | |
| a: { | |
| verticalAlign: 'middle' | |
| } | |
| }, | |
| lineHeight: 8, | |
| padding: [0, 5, -2, 0] | |
| }, | |
| color: ['#6E99F0', '#47C8A3', '#FAC858', '#FFA660', '#FF8579', '#A3B3D6'], | |
| series: [ | |
| { | |
| type: 'pie', | |
| minAngle: 25, | |
| center: [subtext ? '5%' : '18%', subtext ? '20%' : '45%'], | |
| radius: ['75%', '116%'], | |
| left: 'center', | |
| top: 'center', | |
| avoidLabelOverlap: false, | |
| labelLine: { | |
| show: false | |
| }, | |
| label: { | |
| show: false | |
| }, | |
| data | |
| } | |
| ] | |
| }); | |
| myChart.resize(); | |
| window.addEventListener('resize', () => { | |
| myChart.resize(); | |
| }); | |
| }); | |
| }, | |
| lineInit(date, data, subtext = '(%)', tab = 'node') { | |
| data = data.filter(i=>+i.value != 0); | |
| if (data.length < 1) { | |
| this.isNoData = true; | |
| } else { | |
| this.isNoData = false; | |
| } | |
| if (this.isNoData) return; | |
| this.$nextTick(()=>{ | |
| let myChart = echarts.init(this.$refs['pie']); | |
| myChart.clear(); | |
| myChart.setOption({ | |
| tooltip: { | |
| trigger: 'axis', | |
| position: function(point, params, dom, rect, size) { | |
| var x = 0; // x坐标位置 | |
| var y = 0; // y坐标位置 | |
| var pointX = point[0]; | |
| var pointY = point[1]; | |
| // 提示框大小 | |
| var boxWidth = size.contentSize[0]; | |
| var boxHeight = size.contentSize[1]; | |
| if (boxWidth > pointX) { | |
| x = 5; | |
| } else { // 左边放的下 | |
| x = pointX - boxWidth; | |
| } | |
| if (boxHeight > pointY) { | |
| y = 5; | |
| } else { // 上边放得下 | |
| y = pointY - boxHeight; | |
| } | |
| return [x, y]; | |
| }, | |
| formatter: function(params) { | |
| let color = params[0].color; | |
| let marker = '<span style="display:inline-block;margin-right:5px;border-radius:10px;width:9px;height:9px;background-color:' + color + ';"></span>'; | |
| let res = params[0].name + '<br/>' + marker + params[0].value + subtext; | |
| return res; | |
| } | |
| }, | |
| grid: { | |
| top: '13%', | |
| left: '15%', | |
| right: 0, | |
| bottom: '20%' | |
| }, | |
| xAxis: { | |
| type: 'category', | |
| offset: 8, | |
| data: date, | |
| axisLabel: { | |
| color: '#666', | |
| formatter: function(value) { | |
| return value.substring(value.length - 8); | |
| } | |
| } | |
| }, | |
| title: { | |
| subtext: subtext, | |
| subtextStyle: { | |
| textAlign: 'right', | |
| color: '#666' | |
| }, | |
| // padding: [0, 10], | |
| top: 0, | |
| left: tab === 'node' ? '5%' : '8%', | |
| itemGap: 0 | |
| }, | |
| yAxis: { | |
| type: 'value', | |
| boundaryGap: false, | |
| axisLine: { | |
| show: false | |
| }, | |
| axisLabel: { | |
| color: '#666' | |
| }, | |
| axisTick: { | |
| show: false | |
| } | |
| }, | |
| series: [ | |
| { | |
| type: 'line', | |
| symbol: 'none', | |
| sampling: 'lttb', | |
| itemStyle: { | |
| color: 'rgb(110, 153, 240)' | |
| }, | |
| areaStyle: { | |
| color: new echarts.graphic.LinearGradient(0, 0, 0, 1, [ | |
| { | |
| offset: 0, | |
| color: '#6E99F0' | |
| }, | |
| { | |
| offset: 1, | |
| color: '#ffffff' | |
| } | |
| ]) | |
| }, | |
| data: data | |
| } | |
| ] | |
| }); | |
| myChart.resize(); | |
| window.addEventListener('resize', () => { | |
| myChart.resize(); | |
| }); | |
| }); | |
| }, | |
| markLineInit(date, data, subtext = '(%)', tab = 'node', limit, request) { | |
| data = data.filter(i=>+i.value != 0); | |
| if (data.length < 1) { | |
| this.isNoData = true; | |
| } | |
| if (this.isNoData) return; | |
| this.$nextTick(()=>{ | |
| let myChart = echarts.init(this.$refs['pie']); | |
| myChart.clear(); | |
| myChart.setOption({ | |
| tooltip: { | |
| trigger: 'axis', | |
| position: function(point, params, dom, rect, size) { | |
| var x = 0; // x坐标位置 | |
| var y = 0; // y坐标位置 | |
| var pointX = point[0]; | |
| var pointY = point[1]; | |
| // 提示框大小 | |
| var boxWidth = size.contentSize[0]; | |
| var boxHeight = size.contentSize[1]; | |
| if (boxWidth > pointX) { | |
| x = 5; | |
| } else { // 左边放的下 | |
| x = pointX - boxWidth; | |
| } | |
| if (boxHeight > pointY) { | |
| y = 5; | |
| } else { // 上边放得下 | |
| y = pointY - boxHeight; | |
| } | |
| return [x, y]; | |
| }, | |
| formatter: function(params) { | |
| let color = params[0].color; | |
| let marker = '<span style="display:inline-block;margin-right:5px;border-radius:10px;width:9px;height:9px;background-color:' + color + ';"></span>'; | |
| let res = params[0].name + '<br/>' + marker + params[0].value + subtext; | |
| return res; | |
| } | |
| }, | |
| color: ['#6E99F0'], | |
| title: { | |
| subtext: subtext, | |
| subtextStyle: { | |
| textAlign: 'right', | |
| color: '#666' | |
| }, | |
| top: 0, | |
| left: tab === 'node' ? '5%' : '8%', | |
| itemGap: 0 | |
| }, | |
| grid: { | |
| top: '15%', | |
| left: '15%', | |
| right: 0, | |
| bottom: '15%' | |
| }, | |
| xAxis: { | |
| type: 'category', | |
| boundaryGap: false, | |
| data: date, | |
| axisLabel: { | |
| color: '#666', | |
| formatter: function(value) { | |
| return value.substring(value.length - 8); | |
| } | |
| } | |
| }, | |
| yAxis: { | |
| type: 'value', | |
| max: limit >= request ? limit + 1 : request + 1, | |
| boundaryGap: false, | |
| axisLine: { | |
| show: false | |
| }, | |
| axisLabel: { | |
| color: '#666' | |
| }, | |
| axisTick: { | |
| show: false | |
| } | |
| }, | |
| series: { | |
| type: 'line', | |
| data: data, | |
| markLine: { | |
| silent: true, | |
| data: [ | |
| { | |
| yAxis: limit, | |
| lineStyle: { | |
| color: '#47C8A3', | |
| type: 'solid', | |
| cap: 'round' | |
| } | |
| }, | |
| { | |
| yAxis: request, | |
| lineStyle: { | |
| type: 'solid', | |
| cap: 'round', | |
| color: '#FAC858' | |
| } | |
| } | |
| ] | |
| } | |
| } | |
| }); | |
| myChart.resize(); | |
| window.addEventListener('resize', () => { | |
| myChart.resize(); | |
| }); | |
| }); | |
| } | |
| } | |
| }; | |
| </script> | |
| <style lang="scss" scoped> | |
| .echarts { | |
| width: 100%; | |
| } | |
| .no-data { | |
| width: 100%; | |
| height: 220px; | |
| display: flex; | |
| justify-content: center; | |
| align-items: center; | |
| } | |
| .chart-header { | |
| display: flex; | |
| justify-content: space-between; | |
| align-items: center; | |
| } | |
| .chart-title { | |
| font-weight: 600; | |
| color: #333333; | |
| font-size: 16px | |
| } | |
| </style> |
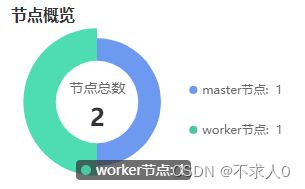
使用 chartPan.vue 之饼图
| <chartPan | |
| ref="pieNode" | |
| :title="tab == 'node' ? '节点' : '负载'" | |
| /> | |
| console.log('arr', arr); // [ {"name": "master节点","value": "1" },{ "name": "worker节点", "value": "1"}] | |
| console.log('sum', sum); // sum 2 | |
| this.$refs.pieNode ? this.$refs.pieNode.pieInit(arr, `${this.tab === 'node' ? '节点' : ''}总数`, sum, 'node) : ''; | |
效果
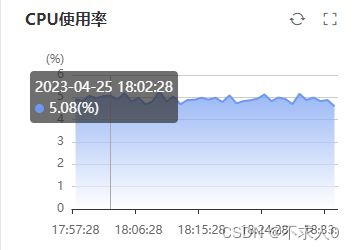
使用 chartPan.vue 之折线图
| <chartPan | |
| ref="cpu" | |
| :title="tab == 'node' ? 'CPU使用率' : 'CPU用量'" | |
| chart-type="line" | |
| chart-height="200px" | |
| > | |
| <div slot="right"> | |
| <i | |
| class="iconfont icon-color icon-shuaxin" | |
| @click="getUseRateCpu" | |
| /> | |
| <i | |
| class="iconfont icon-color icon-fangda" | |
| style="margin-left: 12px" | |
| @click="handlePreViewChart('cpu', tab == 'node' ? 'CPU使用率' : 'CPU用量')" | |
| /> | |
| </div> | |
| </chartPan> | |
| console.log('chartDate', chartDate); // ['2023-04-25 17:57:01', '2023-04-25 17:58:01', '2023-04-25 17:59:01',] | |
| console.log('chartData', chartData); // [4.92, 4.84, 5.07, 4.96, 5.06,] | |
| this.$refs.cpu ? this.$refs.cpu.lineInit(chartDate, chartData, this.tab === 'node' ? '(%)' : '(核)', this.tab) : ''; |
效果
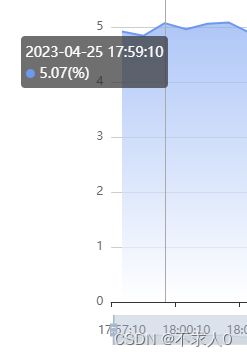
展开大图
handlePreViewChart 事件
| <maxChart | |
| ref="maxChart" | |
| :chart-data="chartPublicData" | |
| /> | |
| // 展示大dialog 图形 | |
| handlePreViewChart(type, title) { | |
| console.log('maxCpuChartData', this.maxCpuChartData); // | |
| { | |
| subtext: "(%)", | |
| maxChartDate : [ "2023-04-25 17:57:10", "2023-04-25 17:58:10","2023-04-25 17:59:10","2023-04-25 18:00:10",], | |
| maxChartData : [4.92,4.84,5.07] | |
| } | |
| this.chartPublicData = type === 'cpu' ? { ...this.maxCpuChartData } : { ...this.maxMemChartData }; | |
| this.$refs.maxChart.title = title; | |
| this.$refs.maxChart.dialogVisible = true; | |
| }, |
大图组件 maxChart.vue
| <template> | |
| <el-dialog | |
| :title="title" | |
| :visible.sync="dialogVisible" | |
| append-to-body | |
| width="1000px" | |
| @open="openDialogVisible" | |
| > | |
| <div class="dialog-wrap"> | |
| <div | |
| ref="chart" | |
| class="echarts" | |
| /> | |
| </div> | |
| </el-dialog> | |
| </template> | |
| <script> | |
| import echarts from 'echarts'; | |
| export default { | |
| props: { | |
| lineType: { | |
| type: String, | |
| default: 'line' | |
| }, | |
| chartData: { | |
| type: Object, | |
| default: () => {} | |
| } | |
| }, | |
| data() { | |
| return { | |
| title: '', | |
| dialogVisible: false | |
| }; | |
| }, | |
| methods: { | |
| openDialogVisible() { | |
| this.$nextTick(() => { | |
| this.lineType === 'line' ? this.lineInit(this.chartData.maxChartDate, this.chartData.maxChartData, this.chartData.subtext) | |
| : this.markLineInit(this.chartData.maxChartDate, this.chartData.maxChartData, this.chartData.subtext, this.chartData.limit, this.chartData.request); | |
| }); | |
| }, | |
| lineInit(date = [], data, subtext = '(%)') { | |
| this.$nextTick(()=>{ | |
| let myChart = echarts.init(this.$refs['chart']); | |
| myChart.clear(); | |
| myChart.setOption({ | |
| tooltip: { | |
| trigger: 'axis', | |
| position: function(point, params, dom, rect, size) { | |
| var x = 0; // x坐标位置 | |
| var y = 0; // y坐标位置 | |
| var pointX = point[0]; | |
| var pointY = point[1]; | |
| // 提示框大小 | |
| var boxWidth = size.contentSize[0]; | |
| var boxHeight = size.contentSize[1]; | |
| if (boxWidth > pointX) { | |
| x = 5; | |
| } else { // 左边放的下 | |
| x = pointX - boxWidth; | |
| } | |
| if (boxHeight > pointY) { | |
| y = 5; | |
| } else { // 上边放得下 | |
| y = pointY - boxHeight; | |
| } | |
| return [x, y]; | |
| }, | |
| formatter: function(params) { | |
| let color = params[0].color; | |
| let marker = '<span style="display:inline-block;margin-right:5px;border-radius:10px;width:9px;height:9px;background-color:' + color + ';"></span>'; | |
| let res = params[0].name + '<br/>' + marker + params[0].value + subtext; | |
| return res; | |
| } | |
| }, | |
| dataZoom: [ | |
| { | |
| show: date.length > 10, | |
| type: 'slider' | |
| } | |
| ], | |
| grid: { | |
| top: '13%', | |
| left: '10%', | |
| right: 0, | |
| bottom: '10%' | |
| }, | |
| xAxis: { | |
| type: 'category', | |
| offset: 15, | |
| data: date, | |
| axisLabel: { | |
| color: '#666', | |
| formatter: function(value) { | |
| return value.substring(value.length - 8); | |
| } | |
| } | |
| }, | |
| title: { | |
| subtext: subtext, | |
| subtextStyle: { | |
| textAlign: 'right', | |
| color: '#666' | |
| }, | |
| padding: [0, 60], | |
| top: 0, | |
| itemGap: 0 | |
| }, | |
| yAxis: { | |
| type: 'value', | |
| boundaryGap: false, | |
| axisLine: { | |
| show: false | |
| }, | |
| axisLabel: { | |
| color: '#666' | |
| }, | |
| axisTick: { | |
| show: false | |
| } | |
| }, | |
| series: [ | |
| { | |
| type: 'line', | |
| symbol: 'none', | |
| sampling: 'lttb', | |
| itemStyle: { | |
| color: 'rgb(110, 153, 240)' | |
| }, | |
| areaStyle: { | |
| color: new echarts.graphic.LinearGradient(0, 0, 0, 1, [ | |
| { | |
| offset: 0, | |
| color: '#6E99F0' | |
| }, | |
| { | |
| offset: 1, | |
| color: '#ffffff' | |
| } | |
| ]) | |
| }, | |
| data: data | |
| } | |
| ] | |
| }); | |
| myChart.resize(); | |
| window.addEventListener('resize', () => { | |
| myChart.resize(); | |
| }); | |
| }); | |
| }, | |
| markLineInit(date, data, subtext = '(%)', limit, request) { | |
| data = data.filter(i=>+i.value != 0); | |
| if (data.length < 1) { | |
| this.isNoData = true; | |
| } | |
| if (this.isNoData) return; | |
| this.$nextTick(() => { | |
| let myChart = echarts.init(this.$refs['chart']); | |
| myChart.clear(); | |
| myChart.setOption({ | |
| tooltip: { | |
| trigger: 'axis', | |
| position: function(point, params, dom, rect, size) { | |
| var x = 0; // x坐标位置 | |
| var y = 0; // y坐标位置 | |
| var pointX = point[0]; | |
| var pointY = point[1]; | |
| // 提示框大小 | |
| var boxWidth = size.contentSize[0]; | |
| var boxHeight = size.contentSize[1]; | |
| if (boxWidth > pointX) { | |
| x = 5; | |
| } else { // 左边放的下 | |
| x = pointX - boxWidth; | |
| } | |
| if (boxHeight > pointY) { | |
| y = 5; | |
| } else { // 上边放得下 | |
| y = pointY - boxHeight; | |
| } | |
| return [x, y]; | |
| }, | |
| formatter: function(params) { | |
| let color = params[0].color; | |
| let marker = '<span style="display:inline-block;margin-right:5px;border-radius:10px;width:9px;height:9px;background-color:' + color + ';"></span>'; | |
| let res = params[0].name + '<br/>' + marker + params[0].value + subtext; | |
| return res; | |
| } | |
| }, | |
| color: ['#6E99F0'], | |
| title: { | |
| subtext: subtext, | |
| subtextStyle: { | |
| textAlign: 'right', | |
| color: '#666' | |
| }, | |
| top: 0, | |
| left: '8%', | |
| itemGap: 0 | |
| }, | |
| grid: { | |
| top: '15%', | |
| left: '15%', | |
| right: 0, | |
| bottom: '15%' | |
| }, | |
| xAxis: { | |
| type: 'category', | |
| boundaryGap: false, | |
| data: date, | |
| axisLabel: { | |
| color: '#666', | |
| formatter: function(value) { | |
| return value.substring(value.length - 8); | |
| } | |
| } | |
| }, | |
| yAxis: { | |
| type: 'value', | |
| max: limit >= request ? limit + 1 : request + 1, | |
| boundaryGap: false, | |
| axisLine: { | |
| show: false | |
| }, | |
| axisLabel: { | |
| color: '#666' | |
| }, | |
| axisTick: { | |
| show: false | |
| } | |
| }, | |
| series: { | |
| type: 'line', | |
| data: data, | |
| markLine: { | |
| silent: true, | |
| data: [ | |
| { | |
| yAxis: limit, | |
| lineStyle: { | |
| color: '#47C8A3', | |
| type: 'solid', | |
| cap: 'round' | |
| } | |
| }, | |
| { | |
| yAxis: request, | |
| lineStyle: { | |
| type: 'solid', | |
| cap: 'round', | |
| color: '#FAC858' | |
| } | |
| } | |
| ] | |
| } | |
| } | |
| }); | |
| myChart.resize(); | |
| window.addEventListener('resize', () => { | |
| myChart.resize(); | |
| }); | |
| }); | |
| } | |
| } | |
| }; | |
| </script> | |
| <style lang="scss" scoped> | |
| .echarts { | |
| width: 100%; | |
| height: 500px; | |
| } | |
| </style> |
大图效果